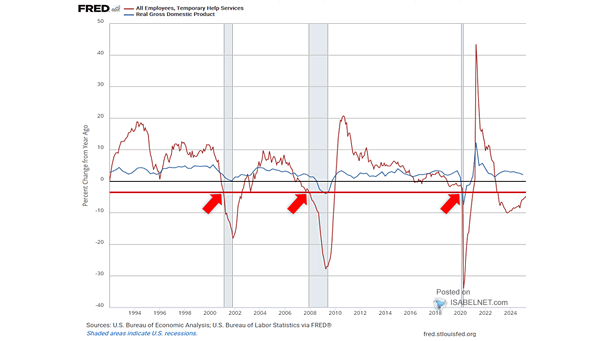
Temporary Help Services Jobs vs. Real GDP and U.S. Recessions
Temporary Help Services Jobs vs. Real GDP and U.S. Recessions Temporary Help Services Jobs stand at -3.77% YoY in December. The relationship between Temporary Help Services jobs and the macroeconomy is complex. Declines in Temporary Help Services Jobs are often considered a leading indicator of a potential recession (red line at -3.5%), but they do…