S&P 500 Index and Technical Score
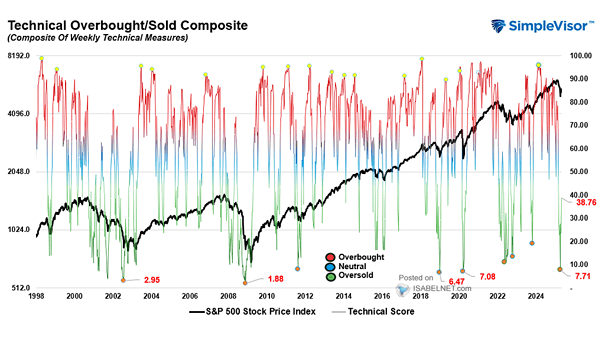
S&P 500 Index and Technical Score With a reading of 73.44, the U.S. stock market has moved out of very overbought territory, potentially signaling an upcoming period of consolidation. Image: Real Investment Advice
S&P 500 Index and Technical Score With a reading of 73.44, the U.S. stock market has moved out of very overbought territory, potentially signaling an upcoming period of consolidation. Image: Real Investment Advice
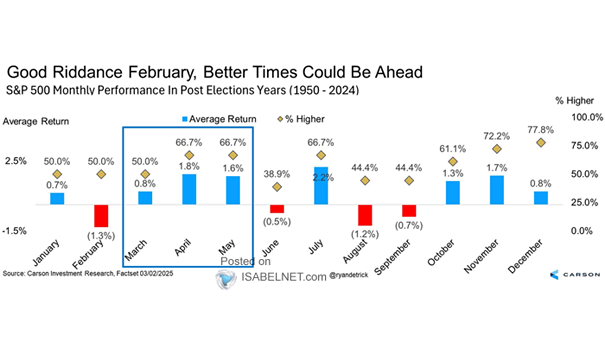
Seasonality – S&P 500 Index Performance Post-Election Years In post-election years since 1950, February has been a challenging month for investors, with the stock market experiencing an average decline of 1.3% and negative returns 50% of the time. Image: Carson Investment Research

ISM Manufacturing Index vs. S&P 500 Index The U.S. ISM Manufacturing Index reached 50.9% in January, surpassing the 49.8% consensus forecast and indicating expansion in the manufacturing sector. This chart shows the correlation between the U.S. ISM manufacturing index and the S&P 500 index year-over-year percent change, since 2011. Click the Image to Enlarge…
Consolidated Equity Positioning At the 92nd percentile, consolidated equity positioning is significantly overweight, nearing extreme levels. Such elevated positioning often reflects strong bullish sentiment but can also increase the likelihood of a market reversal. Image: Deutsche Bank Asset Allocation
Mega-Cap Growth & Tech Positioning The high positioning of mega-cap growth and tech stocks, sitting at the 95th percentile, has raised concerns about overconfidence and potential market corrections. Image: Deutsche Bank Asset Allocation
ISABELNET Cartoon of the Day As bears heard Trump’s tariffs were going to cause a bear market, it seems bulls are feeling a bit unwell—perhaps from celebrating too much during the market highs! Have a Great Day, Everyone! 😎
Probability of U.S. Recession Calculated from the Yield Curve The probability of a U.S. recession in 12 months, calculated from the yield curve, stands at 21% in January. Image: Federal Reserve Bank of Cleveland
Risk Appetite Indicator Level and Momentum Factors The risk appetite indicator continues to show a bias towards higher-risk investments, suggesting a positive market outlook and a risk-on environment. Image: Goldman Sachs Global Investment Research
Atlanta Fed GDPNow U.S. Real GDP Estimate The Atlanta Fed’s latest GDPNow forecast projects a 3.9% annualized increase in U.S. real GDP for Q1 2025, reflecting sustained economic growth. Image: Federal Reserve Bank of Atlanta
Tech Equity Flows The DeepSeek selloff was followed by significant tech inflows, highlighting the resilience of investor confidence in the technology sector, despite short-term market fluctuations. Image: Deutsche Bank Asset Allocation
Valuation – Consensus Forward P/E vs. Expected EPS Growth While expected earnings growth, particularly in technology, partly justifies U.S. equity valuation premiums, investors should be wary of risks associated with elevated expectations. Image: Goldman Sachs Global Investment Research