Probability of U.S. Recession
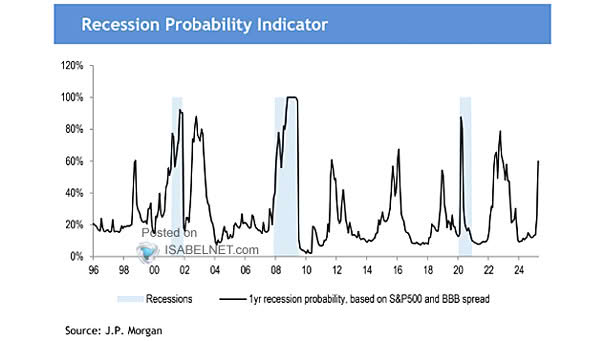
Probability of U.S. Recession The one-year U.S. recession probability implied by the S&P 500 and BBB spread has eased, pointing to a more constructive market tone as fears of near-term economic stress fade. Image: J.P. Morgan