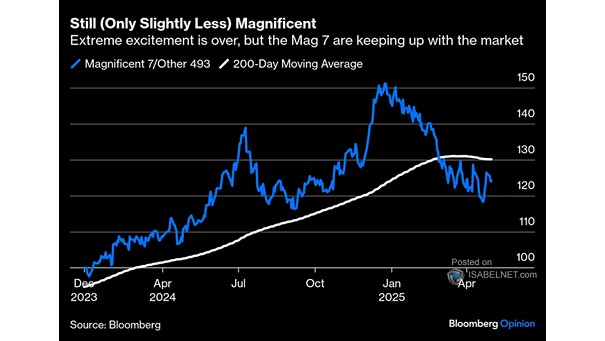
Magnificent 7 vs. S&P 493 Relative Return
Magnificent 7 vs. S&P 493 Relative Return While the Magnificent Seven are expected to continue performing well, their relative outperformance compared to the S&P 493 is projected to be only 7% in 2025, indicating a potential shift in market leadership. Image: Goldman Sachs Global Investment Research