U.S. Net Margin Debt
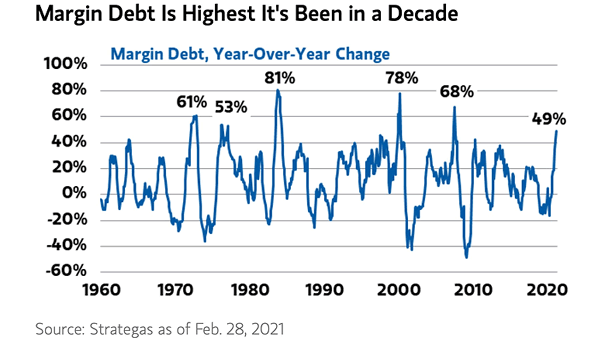
U.S. Net Margin Debt U.S. margin debt is hovering near record highs. That level of borrowing reflects strong risk appetite, but it also leaves the market more exposed to sharp pullbacks if stocks slide and leveraged investors rush to cut positions. Image: Goldman Sachs Global Investment Research