Investor Sentiment – U.S. Market Greed/Fear Index

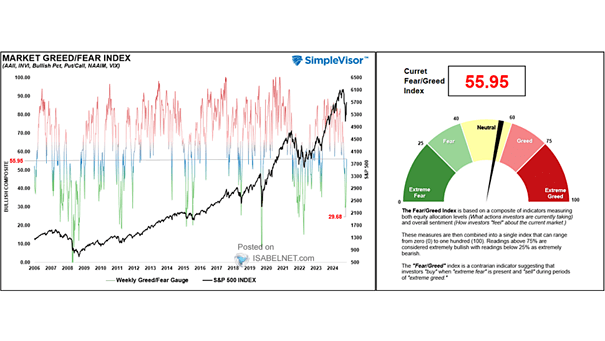
Investor Sentiment – U.S. Market Greed/Fear Index The Market Greed/Fear Index stands at 71.98, still signaling greed in the U.S. stock market without reaching extreme levels. Image: Real Investment Advice

Seasonality – S&P 500 Index Average Monthly Returns

Seasonality – S&P 500 Index Average Monthly Returns Given February’s historical reputation as the weakest month in post-election years, current market volatility is to be expected. Image: Carson Investment Research

Insider Transactions Ratio

Insider Transactions Ratio Bearish sentiment persists among corporate insiders, with the Insider Transactions Ratio reflecting both caution and profit-taking behaviors. Image: Barron’s

U.S. Share of Global Equity Market

U.S. Share of Global Equity Market The U.S. share of the global equity market has risen significantly in recent years. While this concentration has benefited investors with high U.S. exposure, it also raises concerns about proper diversification and exposure to other markets. Image: Goldman Sachs Global Investment Research

Market Capitalization of the S&P 493 as Share of Index Total

Market Capitalization of the S&P 493 as Share of Index Total The 493 smallest stocks in the S&P 500 now account for just 67% of the index’s market capitalization, a record low. This reflects a trend where a few large companies dominate, raising concerns about market concentration. Image: Goldman Sachs Global Investment Research

ISABELNET Cartoon of the Day

ISABELNET Cartoon of the Day Are tariffs the bears’ secret weapon? As bulls struggle with heightened costs and market unpredictability, bears could potentially profit from the economic uncertainties sparked by trade barriers. Have a Great Week, Everyone! 😎

S&P 500 and 10-Month Moving Average

S&P 500 and 10-Month Moving Average The S&P 500’s 2.78% gain in January, including dividends, underscores the strength of the cyclical bull market that began in late 2022. Current conditions suggest continued growth potential. Image: Topdown Charts

Tariffs in United States History

Tariffs in United States History While tariffs were crucial to the early industrialization of the United States, their relevance in today’s global economy is questionable—much like trying to use a rotary phone in a world dominated by smartphones: confusing and outdated. Image: Deutsche Bank

Aggregated U.S. Equity Futures Positions

Aggregated U.S. Equity Futures Positions Leveraged funds and asset managers, while less bullish than before, still express optimism in the market by maintaining substantial net long positions in U.S. equity futures. Image: Deutsche Bank Asset Allocation

Bloomberg Dollar Spot Index

Bloomberg Dollar Spot Index Trump’s tariff policies have strengthened the U.S. dollar while weakening equity markets and cryptocurrencies, as investors worry about the potential consequences of escalating trade tensions. Image: Bloomberg

U.S. Stock Market Bull and Bear Indicator

U.S. Stock Market Bull and Bear Indicator Using multiple financial data, this great model helps investors navigate through different market conditions. It suggests whether the U.S. stock market tendency is bullish, bearish or neutral. It is a contrarian indicator. A bullish signal suggests that the U.S. stock market may go up, while a bearish signal…