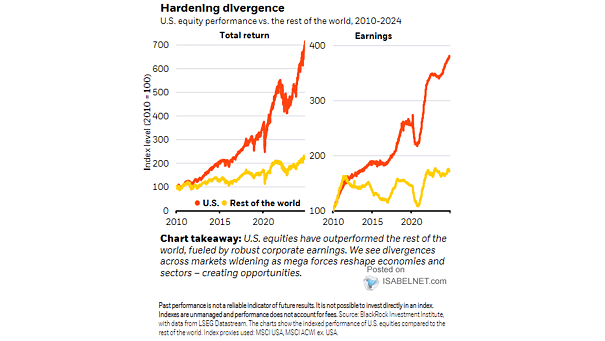
Performance of U.S. vs. Rest of World Equities
Performance of U.S. vs. Rest of World Equities Investing in U.S. corporations is like betting on a horse that always finishes the race—sure, it might stumble, but it usually crosses the finish line ahead of the pack! Image: BlackRock Investment Institute