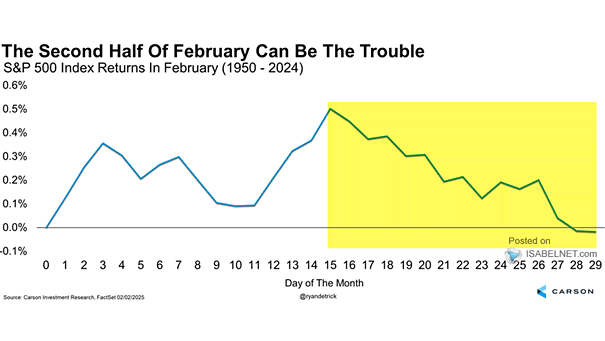
S&P 500 Index Returns in February
S&P 500 Index Returns in February Since 1950, February has historically been a month of flat returns for U.S. stocks, but this overall neutral performance often masks underlying market volatility. Image: Carson Investment Research