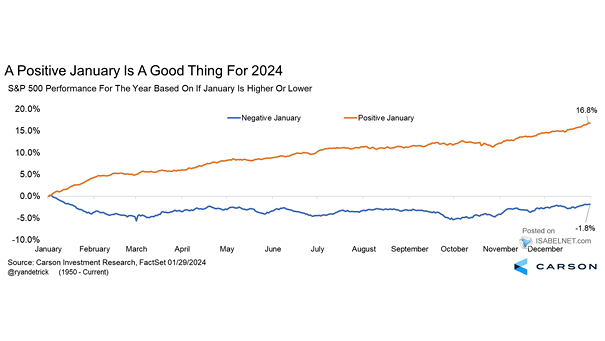
S&P 500 Index Returns Based on if January is Higher or Lower
S&P 500 Index Returns Based on if January is Higher or Lower Bulls have reason to smile, as a strong January is often seen as a bullish sign for the stock market. Historically, a higher S&P 500 in January has been associated with positive full-year returns. Image: Carson Investment Research