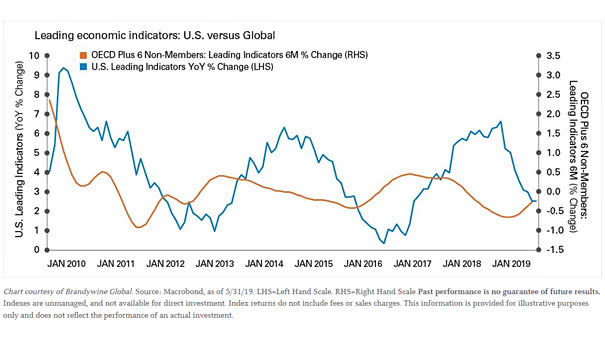
Leading Economic Indicators (LEI): U.S. vs. Global
Leading Economic Indicators (LEI): U.S. vs. Global Leading economic indicators appear to be stabilizing, outside the United States. The central banks’ policy response could have a positive knock-on effect on global growth. Image: Legg Mason