South Korean Exports vs. S&P 500 EPS Estimates
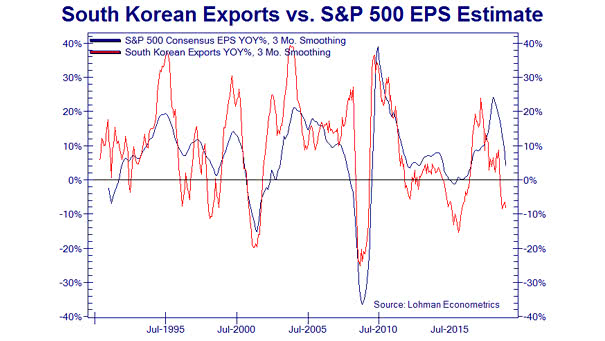
South Korean Exports vs. S&P 500 EPS Estimates The correlation between South Korean exports and S&P 500 EPS estimates suggests a weakness in S&P 500 earnings estimates. Image: Lohman Econometrics
South Korean Exports vs. S&P 500 EPS Estimates The correlation between South Korean exports and S&P 500 EPS estimates suggests a weakness in S&P 500 earnings estimates. Image: Lohman Econometrics
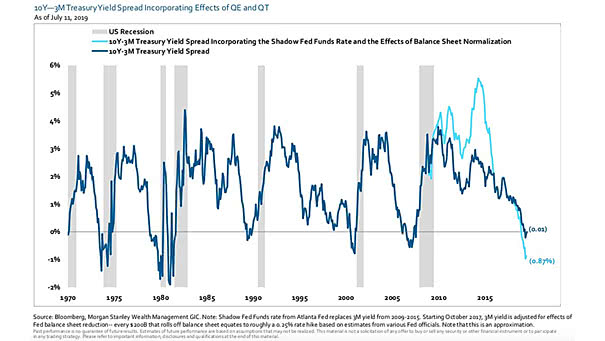
10Y-3M Treasury Yield Spread Adjusted for QE and QT Adjusted for quantitative easing (QE) and quantitative tightening (QT), the 10-year minus 3-month yield curve may have inverted in December 2018. Image: Morgan Stanley Wealth Management

S&P 500 Recovery Since The Financial Crisis The chart shows that the S&P 500 has outperformed its historical recoveries since 2009. Image: Goldman Sachs Global Investment Research
Asset Classes Total Return since the Great Recession The chart shows how asset classes and economic indicators have performed since the Great Recession. The S&P 500 is the big winner. Image: Goldman Sachs Global Investment Research
U.S. Equities and The World: Earnings Growth vs. Multiple Expansion Since the 2009 low, the strong performance of the U.S. markets comes from earnings growth (73%) and multiple expansion (27%). You may also like “S&P 500 Return: Earnings Growth vs. Multiple Expansion.” Image: Goldman Sachs Global Investment Research
Conference Board U.S. LEI and U.S. Treasury 10-Year/2-Year Spread Is a rate cut justified in July? Just take a look at the Conference Board Leading Economic Index and the U.S. Treasury 10-Year/2-Year spread. Image: Strategas
S&P 500 – Secular Roadmaps The chart shows the S&P 500 projection based on average secular bull and the CAPE model. Image: Fidelity Investments
Central Bank Outlook Interesting chart showing how major central banks will change interest rates by the end of this year (projected interest-rate change). Picture Source: Bloomberg
The GS Financial Conditions Index and The Target Fed Funds Rate The Goldman Sachs Financial Conditions Index is not at its lowest level and the current levels are quite similar than previous first rate cuts. Image: Bianco Research
Lower Incomes Paid the Highest Price Low-income groups are slowly recovering after the financial crisis. Inequality: you may also like “U.S. Net Worth by Wealth Bracket.” Image: Deutsche Bank Global Research
U.S. Net Worth by Wealth Bracket Another chart showing the wealth disparities before and after the Great Recession. Inequality: you may also like “Lower Incomes Paid the Highest Price.” Image: Axios