Predicted Hard-Brexit Job Losses Across Europe
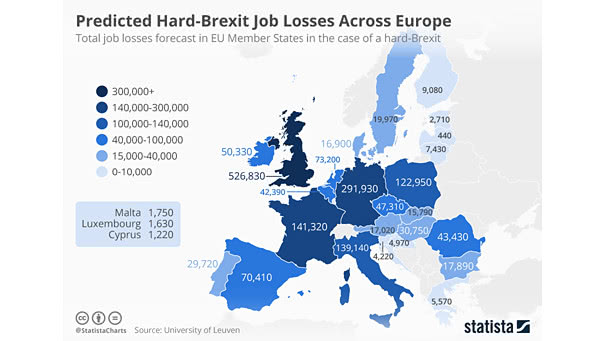
Predicted Hard-Brexit Job Losses Across Europe 1.2 million jobs could be lost across Europe in the case of a hard-Brexit. Image: Statista
Predicted Hard-Brexit Job Losses Across Europe 1.2 million jobs could be lost across Europe in the case of a hard-Brexit. Image: Statista
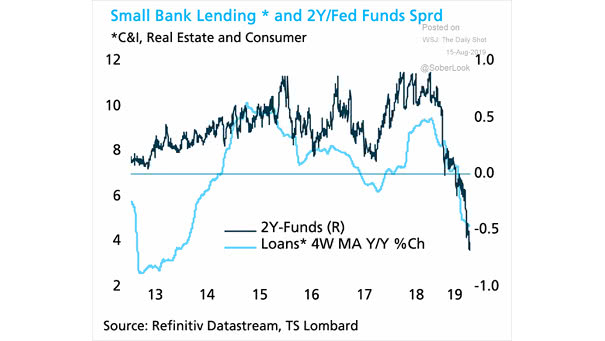
Small Bank Lending and 2-Year/Fed Funds Spread This chart shows the correlation between small bank lending and falling rates, and the negative effect of an inverted yield curve on small bank lending. Image: TS Lombard
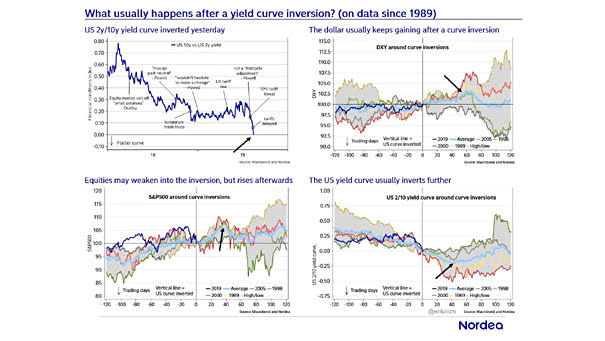
What Usually Happens After A Yield Curve Inversion? Usually, the dollar keeps gaining, equities rises afterwards and the yield curve inverts further. Image: Nordea and Macrobond
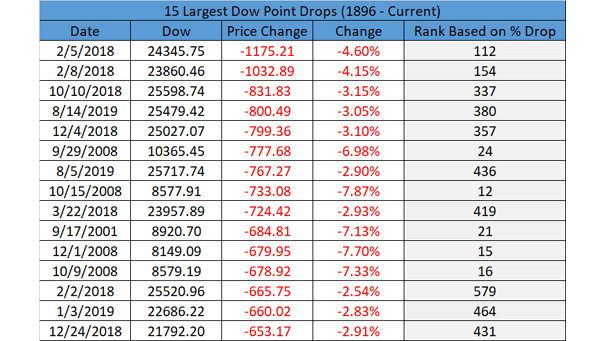
15 Largest Dow Jones Point Drops Going back to 1896, yesterday was the 380th largest percentage drop ever for the Dow Jones. Image: LPL Research
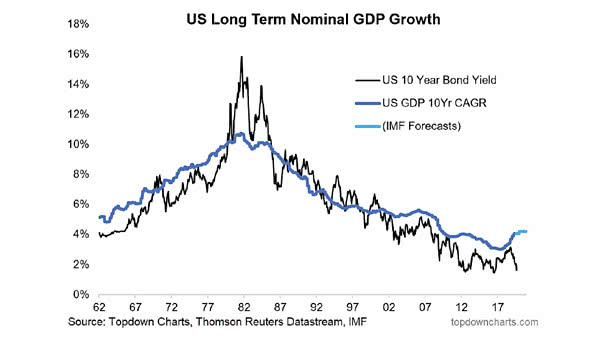
U.S. Long Term Nominal GDP Growth and U.S. 10-Year Bond Yield According to this chart, U.S. bonds are overvalued. Image: Topdown Charts
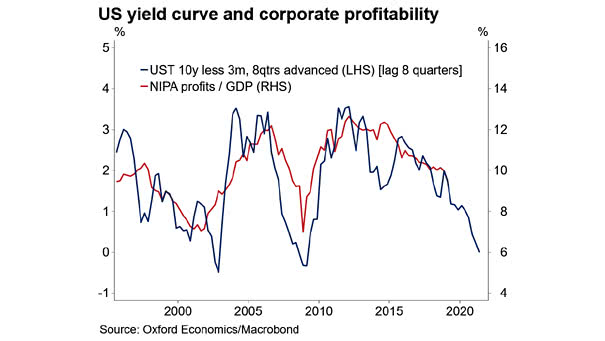
U.S. Yield Curve Leads Corporate Profits This chart suggests that the U.S. 10-year less 3-month yield curve leads corporate profits by two years. Image: Oxford Economics, Macrobond
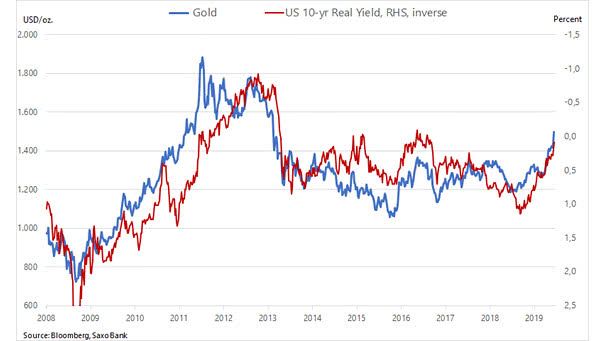
Gold vs. U.S. 10-Year Real Yield The chart shows the nice correlation between the U.S. 10-year real yield (inverted) and the price of gold as a defensive asset Image: Saxo Bank
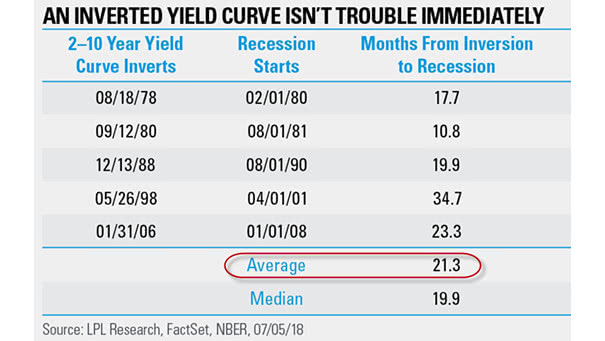
Inverted Yield Curve: Months From Inversion to Recession Historically, the time lag between the inversion and the recession was 21 months Image: LPL Research
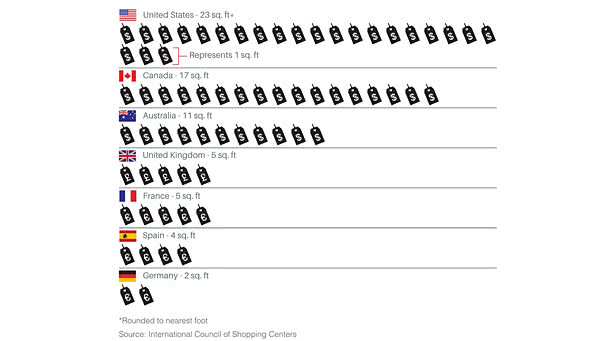
Amount of Retail Space per Person in the U.S. vs. Other Developed Nations America’s retail apocalypse has only just begun. Image: International Council of Shopping Centers
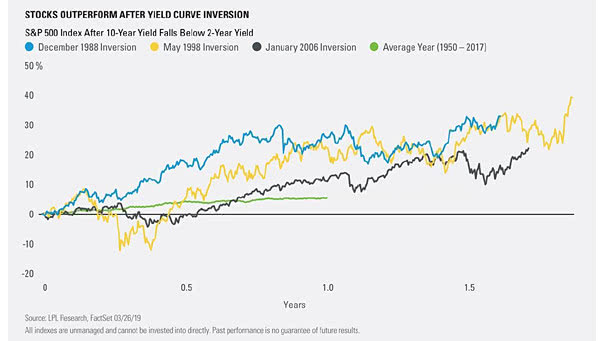
S&P 500 Index After U.S. Treasury 2-10 Year Yield Curve Inversion The chart shows that stocks outperform after yield curve inversion (green line: average year from 1950 to 2017). Image: LPL Research
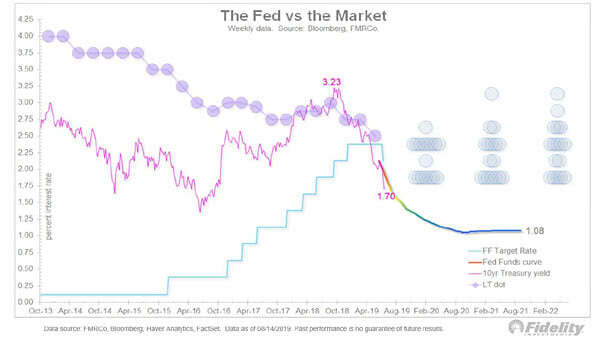
The Fed vs. the 10-Year Treasury Yield The Fed fund curve suggests that the 10-year Treasury yield could fall below its all-time low of 1.32% in 2016. Image: Fidelity Investments