Leveraged Funds and Asset Managers Net Future Positions

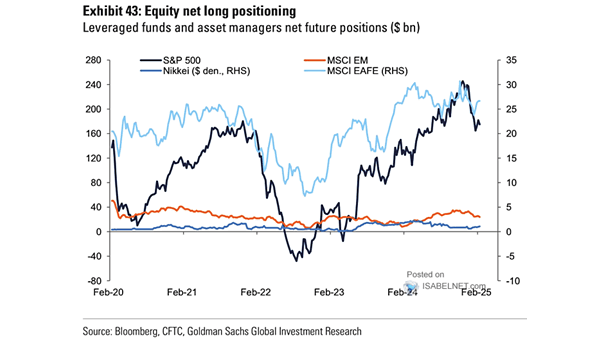
Leveraged Funds and Asset Managers Net Future Positions While showing reduced bullishness, leveraged funds and asset managers maintain a positive market outlook by holding significant net long positions in U.S. equity futures. Image: Goldman Sachs Global Investment Research

U.S. Large-Cap Capex by Company

U.S. Large-Cap Capex by Company Despite DeepSeek’s market impact, leading AI companies are likely to continue using advanced GPUs, with hyperscalers expected to increase AI infrastructure investments. Image: Goldman Sachs Global Investment Research

ISABELNET Cartoon of the Day

ISABELNET Cartoon of the Day With no rate cut expected from the Fed today, bulls are navigating the market like an airplane trying to fly through a hurricane—holding on tight and hoping for calmer skies! Happy “Hump” Day Everyone! 🐫🐪😎

DXY U.S. Dollar Index vs. Nasdaq Composite / MSCI World Value

DXY U.S. Dollar Index vs. Nasdaq Composite / MSCI World Value Over the past two years, U.S. growth stocks—known for their sensitivity to currency fluctuations—have exhibited a strong correlation with the U.S. dollar. Image: Gavekal, Macrobond

GS U.S. Financial Conditions Index

GS U.S. Financial Conditions Index Despite uncertainty surrounding the new administration’s policies, current U.S. financial conditions suggest a supportive environment for growth. Image: Goldman Sachs Global Investment Research

Performance – Stoxx 600 Index – S&P 500 Index

Performance – Stoxx 600 Index – S&P 500 Index While the S&P 500 has benefited from AI-driven gains in recent years, concerns about overvaluation in tech-heavy sectors are prompting investors to seek value in Europe’s more diversified markets. Image: Bloomberg

Fed Funds Rate

Fed Funds Rate Goldman Sachs expects the Fed to implement two 25 basis point rate cuts in 2025, with an additional cut projected for 2026. How will the Fed navigate potential increases in trade tariffs under the Trump administration? Image: Goldman Sachs Global Investment Research

S&P 500 Index Returns Based on 4-Year Presidential Cycle

S&P 500 Index Returns Based on 4-Year Presidential Cycle Bulls have reason to be cheerful as post-election years tend to bring solid market gains. Since 1985, the S&P 500 has risen by an average of over 18% during these years, with positive results in nine out of ten cases. Image: Carson Investment Research

S&P 500 Performance by January Return

S&P 500 Performance by January Return Bulls have reason to smile: Since 1950, when January has shown positive returns, the S&P 500 has ended the year positively 89% of the time, with an average annual gain of 19%. Image: Fundstrat Global Advisors, LLC

S&P 500 Valuation vs. History

S&P 500 Valuation vs. History Compared to historical standards, most S&P 500 sector P/E valuations are elevated, raising concerns about potential market overvaluation. Image: Goldman Sachs Global Investment Research