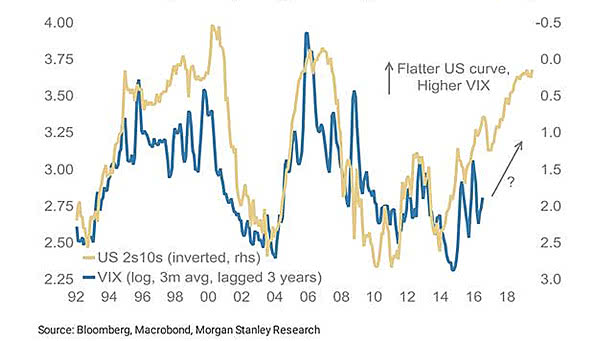
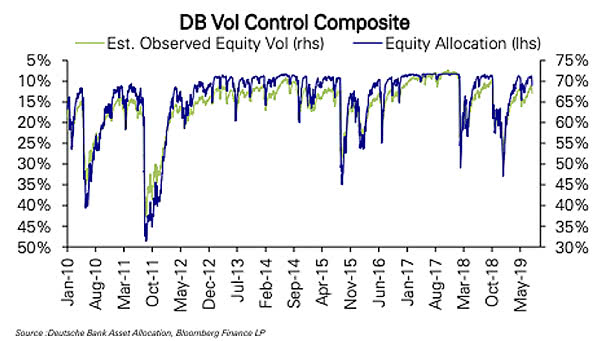
ISM Manufacturing Index Surrounding FED Easing Cycles
ISM Manufacturing Index Surrounding FED Easing Cycles The chart shows that the trend of the ISM Manufacturing Index is quite similar to past cycles before first Fed rate cut. Image: Deutsche Bank
Conference Board U.S. LEI and 6-Month S&P 500 Forward Return A Fed rate cut is good for the S&P 500 when the Conference Board U.S. LEI is positive. Image: Fundstrat Global Advisors, LLC
U.S. Treasury Yields and Inflation Expectations Interesting chart showing the correlation between U.S. Treasury yields and inflation expectations. Image: Foundation Alpha LLC.
Valuation and Demographics Our world is aging with high levels of debt and low interest rates, maybe for a long time. The chart shows that an aging population affects yields. You may also like “Debt and Demographics.” Image: Fidelity Investments
U.S. Core PCE vs. Fed Target The U.S. core personal consumption expenditures price index, which excludes food and energy, rises to 1.6% in June. Inflation trending back up toward the Fed’s 2% target is good news. You may also like “U.S. Core Inflation Expected Over the Next 21 Months.”
U.S. Equities – One Year Return After a Fed Rate Cut The chart shows how U.S. equities have historically performed after a 25 bps and 50 bps Fed rate cut over the last 35 years. You may also like “First Fed Rate Cut.” Image: Ycharts
Gold vs. Real U.S. Rates The chart shows the nice correlation between real U.S. rates (inverted) and the price of gold as a defensive asset. Image: Richardson Wealth
S&P 500 and Bloomberg Barclays U.S. Corporate High Yield Index The chart shows that the S&P 500 and high-yield bonds tend to go up and down together. Keep in mind that historically, the correlation between the S&P 500 and the Bloomberg Barclays U.S. Corporate High Yield Index is 91.7%. Image: First Pacific Advisors, LP
Target Probabilities at the Fed’s July 31 Meeting Today, traders see a 47.6% probability of a 25-bps rate cut and a 52.4% probability of a 50-bps rate cut at the Fed’s July 31 meeting. Image: CME Group
Growth/Value Stock Ratio Around First Rate Cut: Recession vs. No Recession After first Fed rate cut and no recession within the next 12 months, growth stocks should outperform value stocks. Image: LPL Research
S&P 500 Returns After Rate Cuts Near Highs Since 1980, the Fed has cut rates 17 times (S&P 500 within 2% of new highs). One year later, the S&P 500 was still higher. Image: Ryan Detrick, LPL Financial LLC