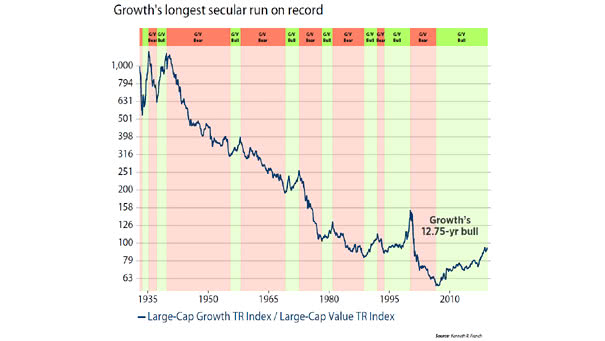
Will Value Ever Outperform Growth?
Will Value Ever Outperform Growth? When the U.S. economy is weak, investors prefer growth stocks. But value could outperform again, when the U.S. economy will be stronger. Image: Ned Davis Research
Will Value Ever Outperform Growth? When the U.S. economy is weak, investors prefer growth stocks. But value could outperform again, when the U.S. economy will be stronger. Image: Ned Davis Research
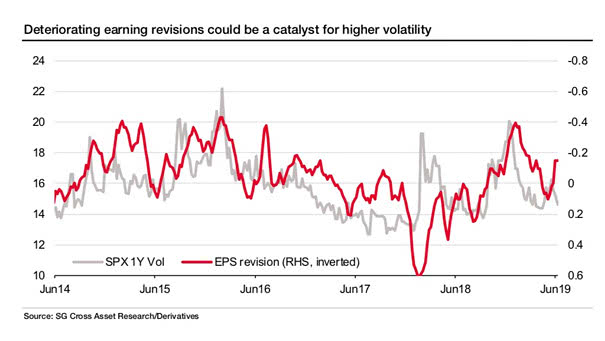
S&P 500 1-Year Volatility vs. EPS Revisions This chart from SG shows a good correlation between earning revisions and the S&P 500 1-year volatility. You may also like “S&P 500 1-Month Volatility History Since 1928 and VIX Since 1990.” Image: Societe Generale Cross Asset Research

Warning Signs of the Next Financial Crisis Some vulnerabilities in the global economy pose a risk for investors and could amplify the next financial crisis. Image: International Monetary Fund
Value of U.S. Corporate Bonds by Rating Since the Great Recession, the U.S. corporate bond debt rated ‘BBB’ exceeds $3 trillion. If the U.S. economy goes wrong, this is bad news for investors. Image: The Wall Street Journal
Global Yield Curves Global flattening yield curves sound the alarm about the economic outlook. Image: Capital Economics
S&P 500 Cash Return Yield by Sector and Region Currently, the S&P 500 cash return yield (buybacks + dividends) is 5.2%, the highest since 2011. That’s much more than Europe, Japan and emerging markets. Image: Fundstrat Global Advisors, LLC
Increased Tariffs Between the U.S. and China: Is It Bad or Good for the U.S.? The survey shows the huge gap between Republicans and Democrats. Image: The New York Times Company
Foreign Holders of U.S. Debt Currently, China and Japan hold the most U.S. debt. Image: howmuch.net
S&P 500 Low Volatility Stocks Are the Best Performing Asset YTD This chart shows that S&P 500 low volatility stocks are the best performing asset year-to-date (outside of GSCI energy). Actually, high-quality stocks are a good way to protect against a weak economy. Image: Goldman Sachs Global Investment Research
History of the Real Federal Minimum Wage Today, the real federal minimum wage is worth 31% less than in 1968. It is also the longest period without an increase (adjusted for inflation). You may also like “Wage Growth vs. U.S. Home Price Growth.” Image: Economic Policy Institute
U.S. Monthly Average 30-Year Fixed Mortgage Rates Keep in mind that mortgage costs are influenced by the 10-year Treasury yield. 30-year mortgage rates = 1.739 x (10-year treasury yield)² + 0.7755 x (10-year treasury yield) + 0.0227(R² = 0.9787) You may also like “30-Year Mortgage Rates vs. 10-Year Treasury Yield.” Image: Leonard Kiefer