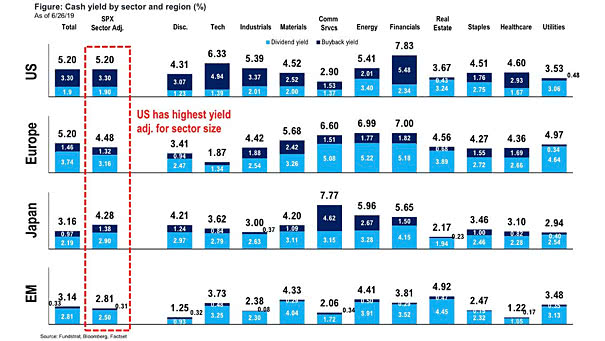
Global PMI & US ISM Manufacturing Indices

Global PMI & US ISM Manufacturing Indices This chart suggests that Global PMI Manufacturing Index leads US ISM Manufacturing Index by two months. Image: Capital Economics

Late-cycle Worries

Late-cycle Worries Consumers are currently more optimistic today than about the future. That’s worrying because consumer spending contributes 70% of total U.S. production. Image: Deutsche Bank

U.S. Debt Ratios to GDP (Household, Corporate, Government)

U.S. Debt Ratios to GDP (Household, Corporate, Government) U.S. households remain far less in debt than during the Great Recession, but U.S. corporate debt continues to rise rapidly and has exceeded record levels . Image: Pictet Wealth Management

U.S. Employment by Sector since 1850

U.S. Employment by Sector since 1850 Over time, the U.S. employment became less dependent on agriculture and much more diversified. Image: Deutsche Bank

U.S. Business Expansions Length by Month since 1854

U.S. Business Expansions Length by Month since 1854 Since 1854, the U.S. was in recession 35% of the time. U.S. recessions are becoming rarer over time and partly explain the increasing survival of zombie firms. Image: Deutsche Bank

Gold Bullion and Market Capitalization of Global Negative Yielding Debt

Gold Bullion and Market Capitalization of Global Negative Yielding Debt This chart shows a strong correlation between gold and market capitalization of global negative yielding debt. Keep in mind that negative global yields are a support for gold. Image: Pictet Wealth Management

MSCI Emerging Markets Index vs. World Semiconductor Sales

MSCI Emerging Markets Index vs. World Semiconductor Sales This great chart suggests that world semiconductor sales lead the MSCI emerging markets index by 3 months. Very interesting chart before investing in emerging market equities. Country weights of the MSCI Emerging Markets Index: 33% China, 13.02% Korea, 11.35% Taiwan. Image: Nordea and Macrobond

Global Equity Fund Flows

Global Equity Fund Flows This great chart from Deutsche Bank shows that equity outflows over the last 6 months are now the largest on record. In 2011 and 2016, it was similar and equities rose significantly. Image: Deutsche Bank