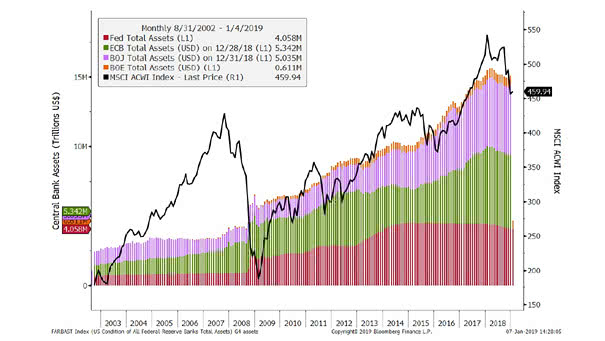
Central Bank Balance Sheets vs. Global Equities
Central Bank Balance Sheets vs. Global Equities Central banks do influence some asset prices, but correlation is not causation. Image: DoubleLine
Central Bank Balance Sheets vs. Global Equities Central banks do influence some asset prices, but correlation is not causation. Image: DoubleLine
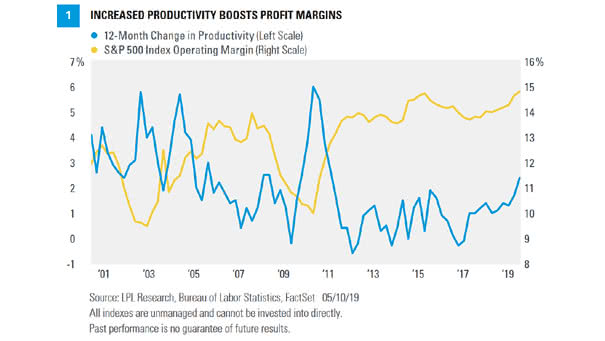
Increased Productivity Boosts Profits Margins When a company increases productivity, it makes more products without increasing costs. Higher productivity can improve the company’s profit margin and total profits. During this business cycle, productivity has increased at an average rate of 1.3% year-over-year. But productivity has been cut in half since the previous business cycle. You…

U.S. Stock Ownership Still Below Pre-Recession Levels Despite the strong performance of stocks since 2009, U.S. stock ownership remains lower than it was before the Great Recession or the Dotcom bubble. Image: Gallup
Real Estate Continues to Lead Stocks as Americans’ Choice for Best Long-Term Investment Americans think that real estate is the best investment vehicle compared to other investments, such as stocks, bonds or gold. Image: Gallup
More than 200 Years of U.S. Interest Rates in One Chart This long term chart covers more than two centuries of US interest rates (yield on the U.S. 10-year Treasury). Image: Goldman Sachs Global Investment Research Click the Image to Enlarge
S&P 500 Index – Number of 5% Corrections Per Year Since 1990, there has been an average of 3.3 separate 5% declines for the S&P 500 per year. In a late business cycle, volatility increases. This is why, in 2019, we could see several drops of 5%. Image: LPL Research
The Progression of World GDP This chart shows the percentage of world GDP by major countries/regions and how China’s GDP has risen steadily over the past few decades. Image: Bank of America Merrill Lynch
91.2% Correlation Between Gold Price and U.S. National Debt According to the National Inflation Association, there’s 91.2% correlation between gold price and U.S. national debt. The U.S. government’s public debt is now more than $22 trillion. Over the long term, the price of gold could continue to rise as debt increases. Image: U.S. Global Investors
Gold Has Crushed the S&P 500 So Far Since 2000 Gold has returned a great 345.30 percent, while the S&P 500 has returned 146.57 percent since 2000. Keep in mind that Gold has beaten the US stock market over multiple time periods Historically, Gold has also had a strong negative correlation with the US stock…
Total Debt by Sector for Developed & Emerging Economies Argentina is the least indebted market in terms of GDP, while Japan is the most indebted market in terms of GDP. The United States’ total debt is 252% of GDP. Image: Pictet Asset Management
Every Fed Tightening Cycle Has Preceded a Slowdown in the ISM Manufacturing Index Since 1950, pullbacks in the ISM Manufacturing Index has coincided with a recession or market selloff, except in 1995. Image: U.S. Global Investors