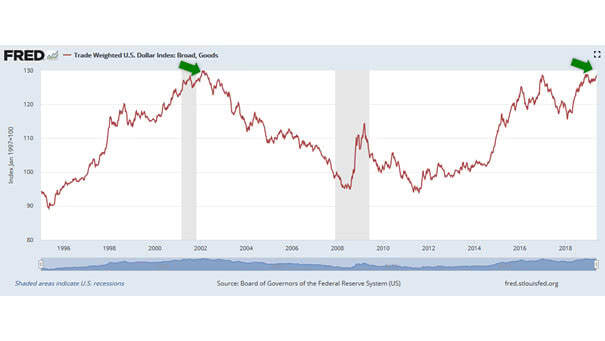
The Progression of World GDP
The Progression of World GDP This chart shows the percentage of world GDP by major countries/regions and how China’s GDP has risen steadily over the past few decades. Image: Bank of America Merrill Lynch
91.2% Correlation Between Gold Price and U.S. National Debt According to the National Inflation Association, there’s 91.2% correlation between gold price and U.S. national debt. The U.S. government’s public debt is now more than $22 trillion. Over the long term, the price of gold could continue to rise as debt increases. Image: U.S. Global Investors
Total Debt by Sector for Developed & Emerging Economies Argentina is the least indebted market in terms of GDP, while Japan is the most indebted market in terms of GDP. The United States’ total debt is 252% of GDP. Image: Pictet Asset Management
Every Fed Tightening Cycle Has Preceded a Slowdown in the ISM Manufacturing Index Since 1950, pullbacks in the ISM Manufacturing Index has coincided with a recession or market selloff, except in 1995. Image: U.S. Global Investors
Lumber Prices Are a Great Leading Indicator of Future Earnings This chart suggests that lumber prices give a good forecast of where the stock market is going. When lumber prices fall over a 12-month period, then EPS follows 6 months later. Although there is no immediate recession on the horizon, a market downturn is possible. Image:…
US Fund Flows 2013-2019 (All Stocks, All Bonds, Mutal Funds and ETFs) Once again, it looks like investors see a recession on the horizon by selling equities and buying bonds. See “The Stock Market Continues to Climb the Wall of Worry” Image: Topdown Charts
Investor Movement Index vs. S&P 500 The Investor Movement Index indicates the sentiment of TD Ameritrade retail investors. Thus, retail investors are net buyers of equities when the stock market is expensive, and they are net sellers of equities when the stock market is cheap. As usual, retail investors react to equity price movements. They buy and sell…
The Stock Market Continues to Climb the Wall of Worry There is always a good reason not to invest in the stock market, but you may miss a significant portion of your capital growth. Image: Bank of America Merrill Lynch
The “Small Businesses Optimism Index” Is a Good Recession Indicator This is not the perfect recession indicator, but when the Small Businesses Optimism Index falls below 100 or more likely below 95, then the risk of a recession remains high. And when the Small Businesses Optimism Index hits an all-time high, a recession may occur…
Why Is “Small Businesses Planning to Hire” a Good Recession Indicator? When the percentage of Small Businesses Planning to Hire, falls from a high level to less than 10%, then the risk of a recession remains high. That’s not the case today, there is no recession coming. Image: National Federation of Independent Business (NFIB)
Stock Buybacks Topped Capital Expenditures for the First Time since 2008 Thanks to corporate tax cuts, stock buybacks hit an all-time high and topped capital expenditures for the first time since 2008. As a reminder, 2008 was the start of the global financial crisis.