U.S. ISM Composite Index and U.S. Real GDP

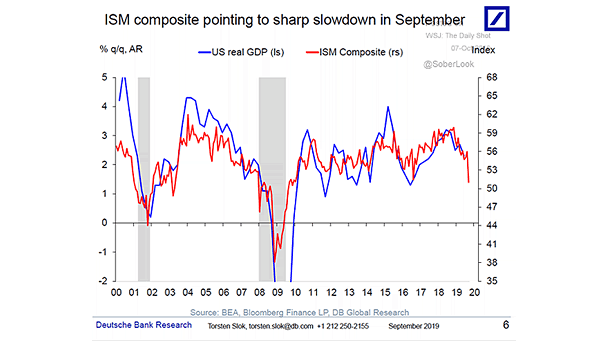
U.S. ISM Composite Index and U.S. Real GDP This chart shows the good correlation between the ISM Composite Index (services + manufacturing) and U.S. real GDP. What about U.S. GDP growth in 2020? Image: Deutsche Bank Global Research
Cass Freight Shipments Index vs. U.S. GDP

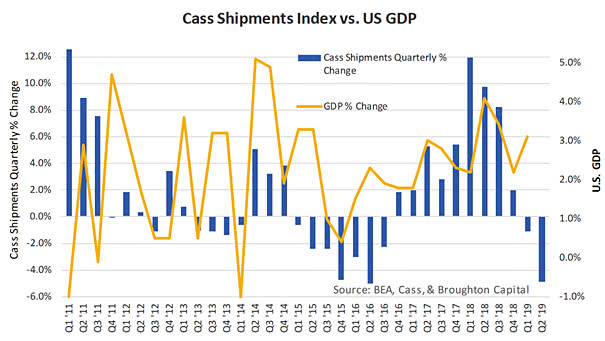
Cass Freight Shipments Index vs. U.S. GDP The Cass Freight Shipments Index is a relative good predictive indicator of the U.S. economy. It suggests a weakness in U.S. GDP in Q2 2019. The Cass Freight Index is a measure of monthly North American freight activity. You may also like “ISM Manufacturing Index vs. Cass Freight Index.”…

Global PMI & US ISM Manufacturing Indices

Global PMI & US ISM Manufacturing Indices This chart suggests that Global PMI Manufacturing Index leads US ISM Manufacturing Index by two months. Image: Capital Economics

ISM Manufacturing vs. 10-Year Treasury Yields

ISM Manufacturing vs. 10-Year Treasury Yields This chart shows a nice correlation between ISM manufacturing index and 10-year Treasury yields since 2010. This chart can explain why 10-year Treasury yields have fallen. PMI index above 50 percent indicates that the manufacturing economy is expanding, and a PMI index below 50 percent indicates that the manufacturing…

Global Manufacturing PMIs – USA vs. Rest of the World

Global Manufacturing PMIs – USA vs. Rest of the World Global ex-US manufacturing PMI is below 50 (contraction). We will see if the United States can go it alone in the coming months. You may also like “ISM Manufacturing Index vs. S&P 500 Index since 2011“ Image: Topdown Charts

Are Fears About an Imminent Recession Overblown?

Are Fears About an Imminent Recession Overblown? Historically, a recession is coming when the Leading Index for the United States is below 1. Today, it stands at 1.37. “The leading index for each state predicts the six-month growth rate of the state’s coincident index. In addition to the coincident index, the models include other variables…

Growth and Inflation

Growth and Inflation This chart shows the ISM Index vs. prices paid deviation from the mean since 2009. Currently, the U.S. manufacturing cycle has headed back into recession & deflation. Image: Fidelity Investments

Copper to Gold Ratio

Copper to Gold Ratio The copper to gold ratio provides useful information on the evolution of the U.S. 10-year Treasury, the ISM Non-Manufacturing Index and the average weekly hours worked. Image: Paolo Cardena

Are We Near a Recession?

Are We Near a Recession? “The leading index for each state predicts the six-month growth rate of the state’s coincident index. In addition to the coincident index, the models include other variables that lead the economy: state-level housing permits (1 to 4 units), state initial unemployment insurance claims, delivery times from the Institute for Supply…