U.S. Total Federal Debt to GDP
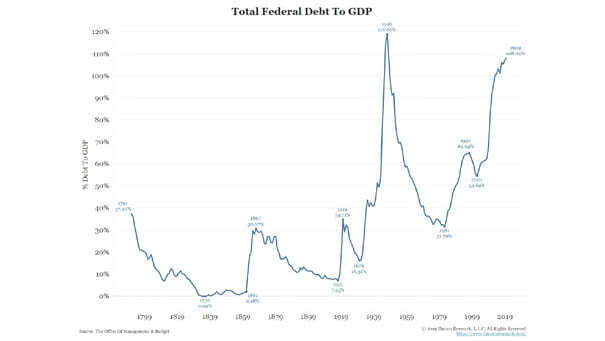
U.S. Total Federal Debt to GDP Another interesting chart showing the U.S. total federal debt to GDP since 1791. The current federal debt to GDP is near an all-time high. Image: Bianco Research
U.S. Total Federal Debt to GDP Another interesting chart showing the U.S. total federal debt to GDP since 1791. The current federal debt to GDP is near an all-time high. Image: Bianco Research
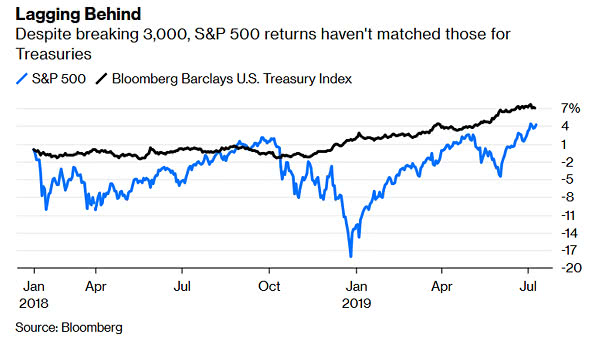
S&P 500 vs. U.S. Treasuries Despite its all-time high, the S&P 500 is below the Bloomberg Barclays U.S. Treasury Index. Picture Source: Bloomberg

Global Equity – Bond Flows According to Bernstein, the S&P 500 not far from its all-time high, could set a new record. Image: Berstein Research
Utilities-to-Gold & Silver Mining Stocks Ratio Since 1990 S&P 500 Utility Sector to Philadelphia Gold and Silver Index hits all-time high. Image: Crescat Capital LLC
The “Small Businesses Optimism Index” Is a Good Recession Indicator This is not the perfect recession indicator, but when the Small Businesses Optimism Index falls below 100 or more likely below 95, then the risk of a recession remains high. And when the Small Businesses Optimism Index hits an all-time high, a recession may occur…
Stock Buybacks Topped Capital Expenditures for the First Time since 2008 Thanks to corporate tax cuts, stock buybacks hit an all-time high and topped capital expenditures for the first time since 2008. As a reminder, 2008 was the start of the global financial crisis.
Big Starts to a Year Can Produce Weak Results Going Forward While new all-time highs and consecutive winning streaks can produce above-average returns in the longer term, pullbacks are possible in the short term. Our previous two articles: “Sell in May and Go Away?” and “Sell in May and Go Away? Maybe Not this Year“…
Can History Help Us Predict the Future of the S&P 500? When the S&P 500 hits all-time high and AAII Investor Sentiment Survey bulls is below 35%, then 88% of the time the S&P 500 is positive one year later (1986-2019). Image: SentimenTrader
U.S. Misery Index and Average Forward Returns The U.S. misery index (core inflation + unemployment) is approaching all-time low, because both inflation and unemployment are very low. Historically, average forward returns have been higher than the overall S&P 500 average.