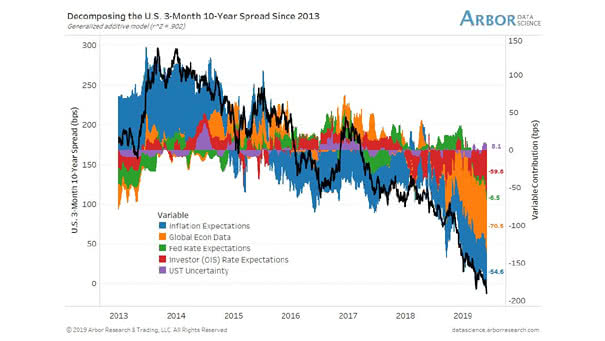
Decomposing the U.S. 10-Year minus 3-Month Treasury Yield Spread since 2013

Decomposing the U.S. 10-Year minus 3-Month Treasury Yield Spread since 2013 This great chart shows that the “Global Economic Data” variable has a significant impact on the U.S. 10-year minus 3-month Treasury yield spread since 2018. An R² of 0.902 means that more than 90 percent of the variance in the U.S. 10-year minus 3-month Treasury yield spread…
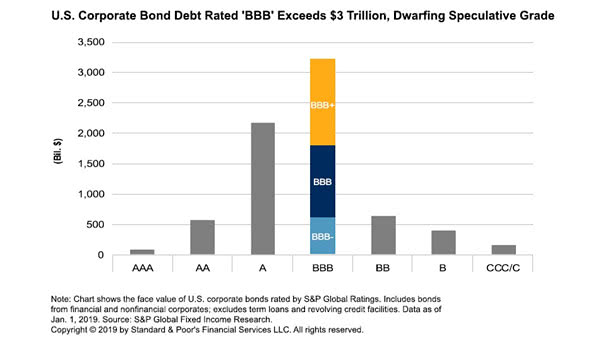
The U.S. Corporate Bond Debt Rated ‘BBB’ Exceeds $3 trillion

The U.S. Corporate Bond Debt Rated ‘BBB’ Exceeds $3 trillion The U.S. corporate bond debt rated ‘BBB’ exceeds $3 trillion. That’s 53% of investment-grade bonds in the United States. Any drop in the credit ratings could amplify the next recession: many investment grade investors own BBB-rated bonds, but are not allowed to hold junk-rated bonds.…

US Yield Curve Inversions since 1966

US Yield Curve Inversions since 1966 Currently, investors are concerned about yield curve inversions, because they have been a indicator of a coming recession. But not all inversions are the same. If the yield curve inversion is due to 10-year falling, then it is a “risk-off” trade, and not an economic cycle turn. This great chart…

“You Need to Divorce your Mind from the Crowd…” –Warren Buffett

“You Need to Divorce your Mind from the Crowd…” –Warren Buffett Quote of the day: “You need to divorce your mind from the crowd. The herd mentality causes all these IQ’s to become paralyzed. I don’t think investors are now acting more intelligently, despite the intelligence. Smart doesn’t always equal rational. To be a successful…

Share of Market Value in Bloomberg Barclays USD IG

Share of Market Value in Bloomberg Barclays USD IG Since 1990, the amount of BBB-rated bonds has doubled. This is only one step away from junk bonds.  Keep in mind that many investment grade investors own BBB-rated bonds, but they are not allowed to hold junk-rated bonds. So, any drop in the credit ratings could…

The Amount of Outstanding Negative-Yielding Debt since 2009

The Amount of Outstanding Negative-Yielding Debt since 2009 Investors are paying governments for the privilege of holding their bonds and are losing so much money in real terms. Raising interest rates in the future could be painful for bond investors. Image: Jeroen Blokland, Bloomberg

91.2% Correlation Between Gold Price and U.S. National Debt

91.2% Correlation Between Gold Price and U.S. National Debt According to the National Inflation Association, there’s 91.2% correlation between gold price and U.S. national debt. The U.S. government’s public debt is now more than $22 trillion. Over the long term, the price of gold could continue to rise as debt increases. Image: U.S. Global Investors

Gold Has Crushed the S&P 500 So Far Since 2000

Gold Has Crushed the S&P 500 So Far Since 2000 Gold has returned a great 345.30 percent, while the S&P 500 has returned 146.57 percent since 2000. Keep in mind that Gold has beaten the US stock market over multiple time periods Historically, Gold has also had a strong negative correlation with the US stock…

Lumber Prices Are a Great Leading Indicator of Future Earnings

Lumber Prices Are a Great Leading Indicator of Future Earnings This chart suggests that lumber prices give a good forecast of where the stock market is going. When lumber prices fall over a 12-month period, then EPS follows 6 months later. Although there is no immediate recession on the horizon, a market downturn is possible. Image:…