Top 5 vs. S&P 500 ex-Top 5 – YoY Contribution of EPS and P/E to Returns

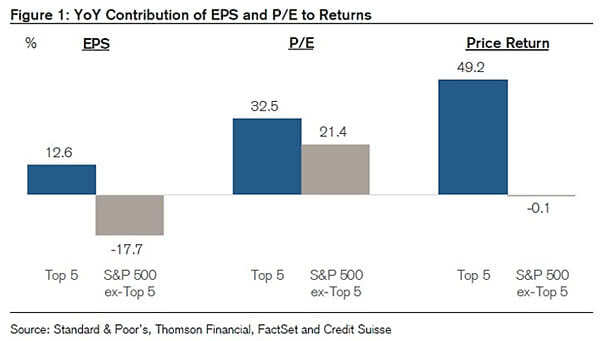
Top 5 vs. S&P 500 ex-Top 5 – YoY Contribution of EPS and P/E to Returns The performance gap could widen further, as the top 5 largest stocks in the S&P 500 are superior on almost every financial metric (revenue, profit growth, margin structure, volatility and corporate leverage). Image: Credit Suisse Research
Number of U.S. IPOs and U.S. IPOs with Negative Earnings

Number of U.S. IPOs and U.S. IPOs with Negative Earnings This chart shows the fall in new listings and the proportion of unprofitable U.S. IPOs at the highest level since the tech bubble. Image: J.P. Morgan Asset Management

IPO Relative Performance in 2019

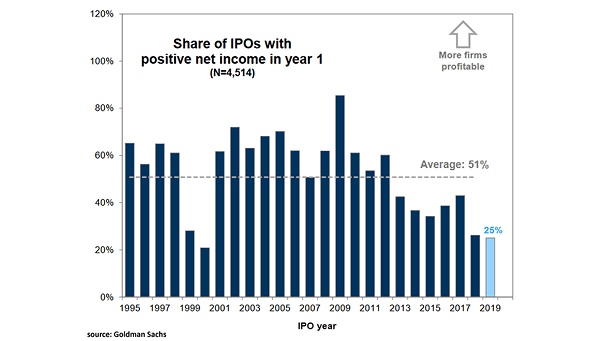
IPO Relative Performance in 2019 The IPO market is suffering in 2019. This year’s IPO class is one of the least profitable. Image: Goldman Sachs Global Investment Research

S&P 500 LTM Return On Equity (ROE)

S&P 500 LTM Return On Equity (ROE) The S&P 500 LTM Return On Equity (ROE) gives a picture of corporate profitability and remains high relative to history. Image: Goldman Sachs Global Investment Research

ECB Balance Sheet vs. ECB Deposit Rate

ECB Balance Sheet vs. ECB Deposit Rate It could be difficult to push rates further into negative territory without affecting the profitability and financing capacity of Eurozone banks. Image: Jeroen Blokland

Total Banking Asset as Percentage of GDP

Total Banking Asset as Percentage of GDP Negative interest rates have a big impact on the profitability of banks and screw up the economy. Image: BofA Merrill Lynch Global Research

Number of Small-Cap M&A Deals At 10-Year High

Number of Small-Cap M&A Deals At 10-Year High The number of small-cap deals is expected to continue to grow, because CEOs are under pressure to increase profits Image: Legg Mason