Annual Performance of S&P 500
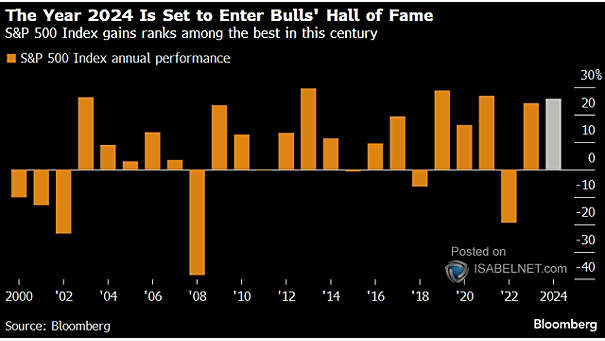
Annual Performance of S&P 500 The S&P 500 Index gained 29% in 2019, its best performance since 2013, boosted by economic data, Fed rate cuts, and the US-China phase-one trade deal. Image: Credit Suisse Research
Annual Performance of S&P 500 The S&P 500 Index gained 29% in 2019, its best performance since 2013, boosted by economic data, Fed rate cuts, and the US-China phase-one trade deal. Image: Credit Suisse Research
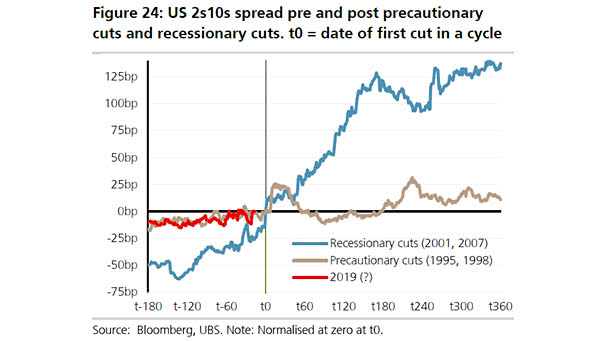
U.S. 10-Year/2-Year Yield Curve and Recession After the first Fed rate cut, a steepening of the U.S. 2-Year/10-Year spread could suggest a recession is coming. Image: UBS

Conference Board U.S. LEI and 6-Month S&P 500 Forward Return A Fed rate cut is good for the S&P 500 when the Conference Board U.S. LEI is positive. Image: Fundstrat Global Advisors, LLC
U.S. Yield Curve vs. Recessions The chart shows the 10-year Treasury yield minus Fed funds rate yield curve and recessions. Historically, a flat or inverted yield curve is associated with slow economic growth or recessions. The longer the yield curve stays inverted, the better it predicts recession. A Fed rate cut similar to 1995 could…
U.S. Recessions since 1957 This chart shows that almost every Fed rate cut has been associated with a recession. Image: John P. Hussman
What is the Biggest Risk Right Now for Investors? What is the Biggest Risk Right Now for Investors? The risk of a Fed policy error The probability of a Fed rate cut in July 2019 is now 84.6%. Image: Bloomberg
Money Market Fund Assets U.S. money market funds usually see outflows within 12 months after the Fed’s first rate cut, as investors rebalance their portfolios and reassess risk in light of changing interest rates and market dynamics. Image: The Daily Shot
GWIM T-Bill Flows In light of the Fed’s recent rate cuts, BofA’s private clients are actively selling T-bills and strategically positioning themselves for potential gains in other asset classes. Image: BofA Global Investment Strategy
Treasury QT The current context suggests that QT can continue even as the Fed begins to cut interest rates, provided that these cuts do not push the policy rate below what is considered neutral. Image: Deutsche Bank
Weekly U.S. Equity Fund Flows U.S. equity funds have seen substantial inflows amounting to $31.74 billion, reflecting a strong positive sentiment among investors, particularly following the Fed’s decision to cut interest rates last week. Image: BofA Global Research
Flows into Equity and Bonds Funds Substantial inflows into equity and bond funds are fueled by investor optimism regarding falling inflation and the potential for interest rate cuts by the Fed. Image: Deutsche Bank Asset Allocation