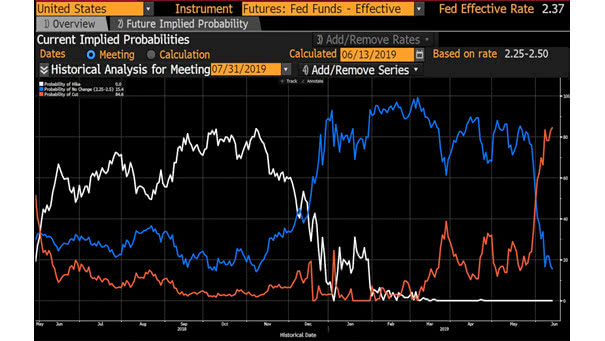
What is the Biggest Risk Right Now for Investors?

What is the Biggest Risk Right Now for Investors? What is the Biggest Risk Right Now for Investors? The risk of a Fed policy error The probability of a Fed rate cut in July 2019 is now 84.6%. Image: Bloomberg

S&P 500 Dividend Payers / Non-Payers Ratio

S&P 500 Dividend Payers / Non-Payers Ratio Amidst 2025’s market volatility, dividend stocks emerge as a compelling investment, offering both steady income and growth potential while serving as a robust tool for portfolio diversification. Image: Ned Davis Research

Long History of U.S. 10-Year Treasury Yields

Long History of U.S. 10-Year Treasury Yields Despite expectations of rate cuts, U.S. interest rates could move in either direction, depending on inflation and Fed decisions. Image: Goldman Sachs Global Investment Research Click the Image to Enlarge

U.S. Money Market Funds

U.S. Money Market Funds Following the Fed’s first rate cut, U.S. money market funds typically experience outflows within 12 months as investors rebalance portfolios and reassess risk in response to changing interest rates and market conditions. Image: Federal Reserve Bank of St. Louis

GWIM T-Bill Flows

GWIM T-Bill Flows In light of the Fed’s recent rate cuts, BofA’s private clients are actively selling T-bills and strategically positioning themselves for potential gains in other asset classes. Image: BofA Global Investment Strategy

Treasury QT

Treasury QT The current context suggests that QT can continue even as the Fed begins to cut interest rates, provided that these cuts do not push the policy rate below what is considered neutral. Image: Deutsche Bank

Weekly U.S. Equity Fund Flows

Weekly U.S. Equity Fund Flows U.S. equity funds have seen substantial inflows amounting to $31.74 billion, reflecting a strong positive sentiment among investors, particularly following the Fed’s decision to cut interest rates last week. Image: BofA Global Research

Flows into Equity and Bonds Funds

Flows into Equity and Bonds Funds Substantial inflows into equity and bond funds are fueled by investor optimism regarding falling inflation and the potential for interest rate cuts by the Fed. Image: Deutsche Bank Asset Allocation

U.S. CPI Inflation vs. U.S. 10-Year Bond Yield

U.S. CPI Inflation vs. U.S. 10-Year Bond Yield CPI dynamics in early 2024 show a clear pattern: Q1’s higher inflation prompted increased Fed scrutiny, while Q2’s declines suggest potential interest rate cuts, impacting market expectations and U.S. Treasury yields on CPI days. Image: BofA Global Research

S&P 500 – Indexed Performance

S&P 500 – Indexed Performance Until the summer, the S&P 500 achieved one of its best starts in history, closely following the trajectory of 1995. During that year, the Fed cut interest rates, marking the last soft landing in the U.S. economy. Image: Goldman Sachs Global Investment Research

Inflation – U.S. CPI Forecasts

Inflation – U.S. CPI Forecasts With inflation high, the Fed’s interest rate cut decisions require a delicate balance between price stability, economic expansion and employment support. Image: BofA Global Investment Strategy