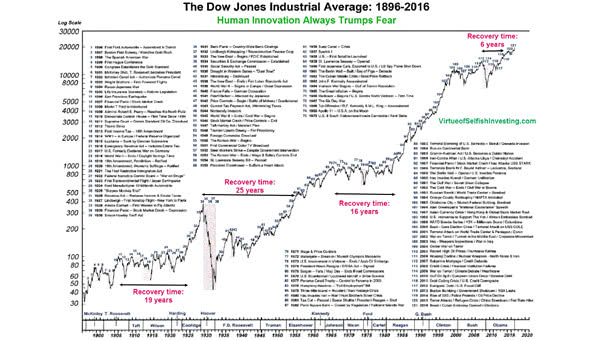
The Dow Jones Industrial Average Since 1896

The Dow Jones Industrial Average Since 1896 If you listen to the news, there is always a good reason not to be invested in the stock market. You may also like “The Stock Market Continues to Climb the Wall of Worry.” Image: virtueofselfishinvesting.com   Click the Image to Enlarge  
How Many People Are There in the World in 2019?

How Many People Are There in the World in 2019? The world population was estimated to have reached 7.7 billion people as of April 2019. Image: Visual Capitalist Click the Image to Enlarge

More than 200 Years of US Interest Rates in One Chart

More than 200 Years of U.S. Interest Rates in One Chart This long term chart covers more than two centuries of US interest rates (yield on the U.S. 10-year Treasury). Image: Goldman Sachs Global Investment Research Click the Image to Enlarge

96% Correlation with the US Stock Market and an R² of 0.92 since 1970

96% Correlation with the US Stock Market and an R² of 0.92 since 1970 Our forecasting models have a fantastic 96% correlation with the US stock market on a quarterly basis since 1970 and an R² of 0.92. It means that 92 percent of the US stock market variance is predictable by the flows of data…

Only 11% of Asset Classes Have Posted Negative Total Returns in 2019

Only 11% of Asset Classes Have Posted Negative Total Returns in 2019 The rally is back, but for how long? According to Deutsche Bank AG, 90% of 70 financial asset classes posted positive total returns. Data for 2019 are through April. Picture Source: The Wall Street Journal

Why a Low or Negative Equity Risk Premium Coincides with a Temporary Market Peak?

Why a Low or Negative Equity Risk Premium Coincides with a Temporary Market Peak? Because it pushes investors into bonds rather than equities. This was the case in 1973, 1981, 2000, 2007 and 2018 before the market crash. The current equity risk premium is available to our subscribers. Our equity risk premium model has a great 96% correlation with…

Why the Stock Market Valuation Matters Before a Recession?

Why the Stock Market Valuation Matters Before a Recession? When the stock market is VERY overvalued before a recession, it tends to be VERY undervalued. Like the swing of a pendulum, or the stretching of a rubber band, sooner or later it comes back very violently. This happened in 1973, 2000 and 2008. The US…

Why the US Stock Market Was Overvalued by 14.2% on Oct. 1, 2018 vs. 7.7% Today?

Why the US Stock Market Was Overvalued by 14.2% on Oct. 1, 2018 vs. 7.7% Today? Because the value of the forecast changes over time (blue dotted line). The US stock market short-term forecast (S&P 500 with dividends reinvested) for the next 12 months is available to our subscribers. This great prediction model is updated daily.…

How’s the U.S. Economy Doing Now?

How’s the U.S. Economy Doing Now? The real GDP Nowcast relies on soft data such as consumer and business surveys and hard data such as retail sales and industrial production. It forecasts the growth of real GDP. At full employment, GDP returns to the level of potential GDP. If a recession were to occur today,…