A Hall of Mirrors in Monetary Policy?
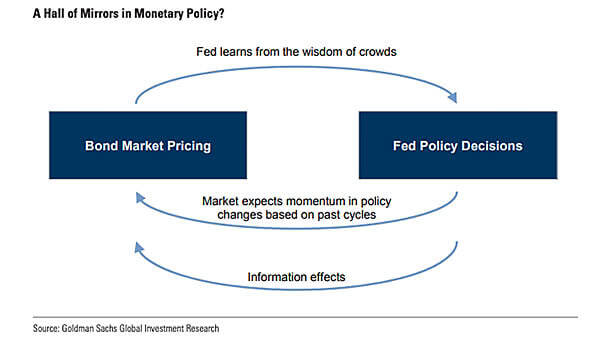
A Hall of Mirrors in Monetary Policy? This chart suggests a feedback loop between bond market pricing and central bank decisions. Image: Goldman Sachs Global Investment Research
A Hall of Mirrors in Monetary Policy? This chart suggests a feedback loop between bond market pricing and central bank decisions. Image: Goldman Sachs Global Investment Research
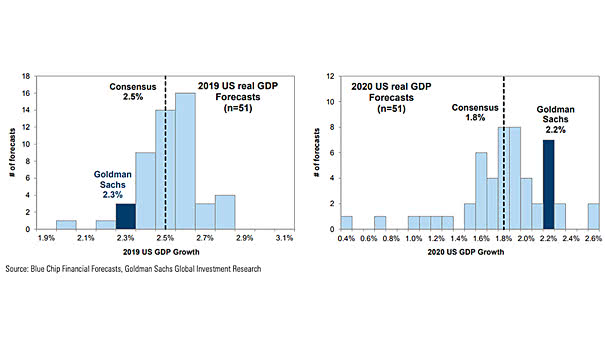
Consensus 2019 & 2020 U.S. Real GDP Growth Goldman Sachs forecasts U.S. real GDP growth of 2.3% in 2019 and 2.2% in 2020 (as of July 2019). Image: Goldman Sachs

Federal Budget Deficit Since 1948 The federal budget deficit is unusually large compared to the state of the U.S. economy. Image: Goldman Sachs
S&P 500 Bull Market This is the longest equities bull market without a 20% drawdown. Image: Goldman Sachs
Liquidity Premium: Investment Grade vs. High Yield Bonds The chart shows that the premium provided by illiquid IG and HY bonds has been drifting wider. Image: Goldman Sachs Global Investment Research
U.S. Dollar and Weak Global Growth This spreadsheet shows that Fed policy easing can weaken the U.S. dollar in times of weak global growth. Image: Goldman Sachs Global Investment Research
Valuation Gap Between High and Low Dividend Yield Stocks This chart shows that the valuation gap between high and low dividend yield stocks is almost the widest ever. Image: Goldman Sachs Global Investment Research
U.S. Government Bond Fund Flows Over the last six months, U.S. government bond fund flows have been the largest since 1985. Image: Goldman Sachs Global Investment Research
U.S. Effective Tariff Rate The U.S. effective tariff rate is rising to the highest in 70 years. You may also like “Tariffs in United States History.” Image: Goldman Sachs Global Investment Research
Tariffs Are Raising Prices for U.S. Consumers The charts show that U.S. consumer and producer prices have risen more quickly in tariff-affected categories. This is unfortunate in this late business cycle. Image: Goldman Sachs Global Research