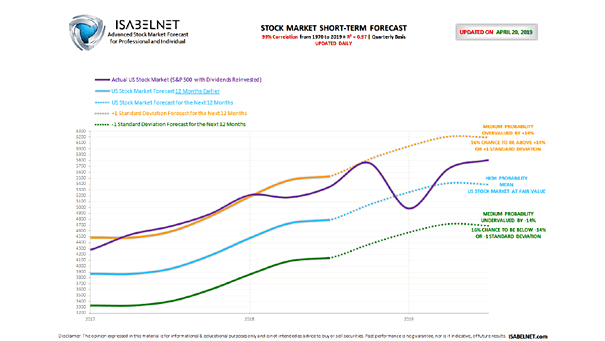
St. Louis Fed Financial Stress Index

St. Louis Fed Financial Stress Index Before a coming recession, also watch the St. Louis Fed Financial Stress Index for forecasting the future. It uses 18 weekly data series to measure financial stress in the market: seven interest rate series, six yield spreads and five other indicators. Each of these variables captures some aspect of financial stress.…

Stock Market Bull and Bear Indicator

This powerful indicator looks into the US stock market and suggests whether it is bullish, bearish or neutral Using multiple financial data, this great model helps investors navigate through different market conditions. It suggests whether the US stock market tendency is bullish, bearish or neutral. It is a contrarian indicator. A bullish signal suggests that…

Stock Market Long-Term Forecast

https://www.isabelnet.com/wp-content/uploads/2019/03/stock-market-long-term-forecast.mp4 This great long-term forecast model displays the annual and total return expected for the next 10 years with a high degree of confidence This advanced model makes a forecast for the next 12 months, next 3 years, next 5 years, and next 10 years, with dividends reinvested. For each period, it displays the annual…

Stock Market Equity Risk Premium

https://www.isabelnet.com/wp-content/uploads/2019/03/stock-market-equity-risk-premium.mp4 This fabulous model shows if the US stock market return for the next 10 years is more or less attractive than the 10-Year Treasury Note The US stock market equity risk premium is the US stock market excess return for the next 10 years over the US 10-year Treasury Note. This is the premium…

Stock Market Short-Term Forecast

https://www.isabelnet.com/wp-content/uploads/2019/03/stock-market-short-term-forecast.mp4 This great tool shows the US stock market forecast for the next 12 months and the probability This advanced mathematical model extracts insights from multiple financial data and suggests a stock market short-term forecast for the next 12 months with a very high degree of confidence. This great prediction model is updated daily, with…

Stock Market Valuation

https://www.isabelnet.com/wp-content/uploads/2019/03/stock-market-valuation.mp4 This powerful model looks into the US stock market and alerts if it is overvalued or undervalued The model shows the valuation percentage to the right and to the left. In the middle, it shows what the probability of each event happening is. Probability is a way to show how often an event will…

Premium Membership

PREMIUM MEMBERSHIP – Click the Images to Enlarge Video tutorials are available by clicking on this link: “FORECASTING MODELS” located in the menu bar at the top of each page. Our daily Stock Market Bull and Bear Indicator is available in the Pro Membership. Upgrade your Premium Membership to a Pro Membership Now! The period of…

Pro Membership

PRO MEMBERSHIP – Click the Images to Enlarge Video tutorials are available by clicking on this link: “FORECASTING MODELS” located in the menu bar at the top of each page.

FAQ

FAQ Most frequent questions and answers Membership Why Subscribe? Stay on the top of the US stock market           Isabelnet subscription prepares you for what is ahead with advanced forecasting models.. Exclusive short- and long-term forecasts           Our models alert our members with US market insight no one else have. Keep up to date with…