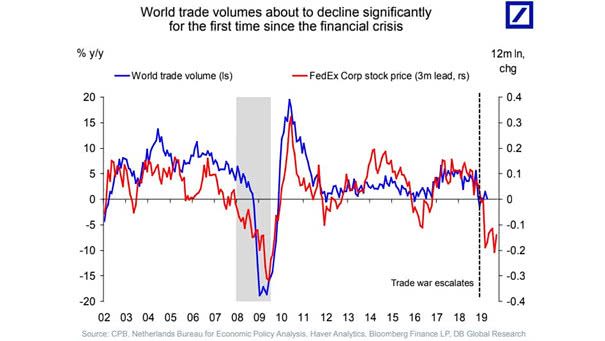
FedEx Stock Price Leads World Trade Volume by Three Months
FedEx Stock Price Leads World Trade Volume by Three Months This chart suggests that FedEx is usually a good leading indicator of the world economy. You may also like “FedEx vs. World Trade.” Image: Deutsche Bank Global Research