Global Flows YTD
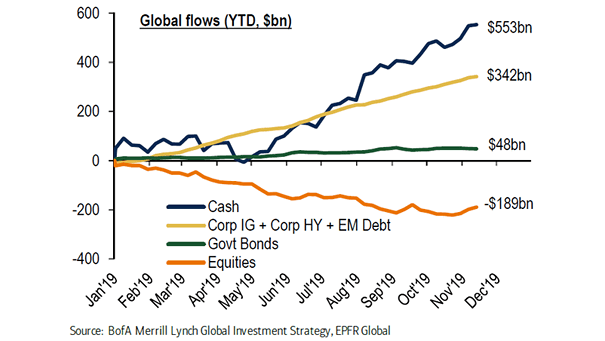
Global Flows YTD Chart showing a record bond inflows and equity outflows this year. Image: BofA Merrill Lynch Global Investment Strategy
Global Flows YTD Chart showing a record bond inflows and equity outflows this year. Image: BofA Merrill Lynch Global Investment Strategy
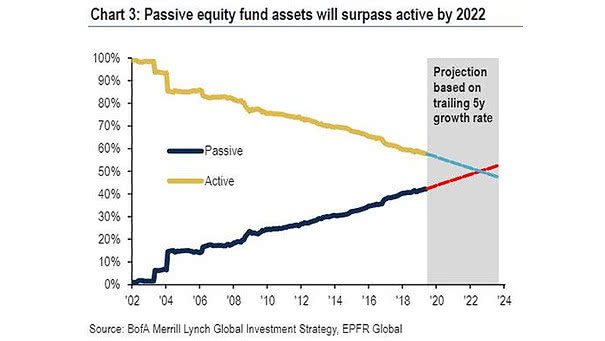
Passive Equity Fund Assets vs. Active Record passive inflows suggest passive equity funds will surpass active by 2022. Image: BofA Merrill Lynch

Cumulative Fund Flows: Global Equities and Global Government & Corporate Bonds $339 billion in inflows to bond funds globally, and $208 billion in outflows from global equity funds in 2019, as investors fear a global recession is on the horizon. Image: BofA Merrill Lynch
U.S. Active vs. Passive Fund Net Flows Active mutual funds exhibit persistent outflows, while inflows into index-tracking U.S. mutual funds and ETFs continue to rise. Image: Bloomberg
The Rise of Passive Investing Net inflows into index-tracking U.S. mutual funds and ETFs rose by around 50% in the second quarter from a year earlier. Image: The Wall Street Journal
The Great Re-allocation from Equities to Bonds Continues Since the end of 2018, S&P 500 ETFs have seen outflows, while long Treasury ETFs have seen inflows. Image: Macrobond and Nordea
Money-Market Funds Flows Over the last 4 weeks, money-market funds have seen a significant inflow of nearly $95 billion. That’s much more larger than in previous years. Image: Deutsche Bank Asset Allocation
US Equity Market Sentiment and Relative ETF Flows Since 2018 This chart shows the correlation between US equity market sentiment and relative ETF flows recently. Inflow to US equity type ETF has picked up recently. Image: Nomura