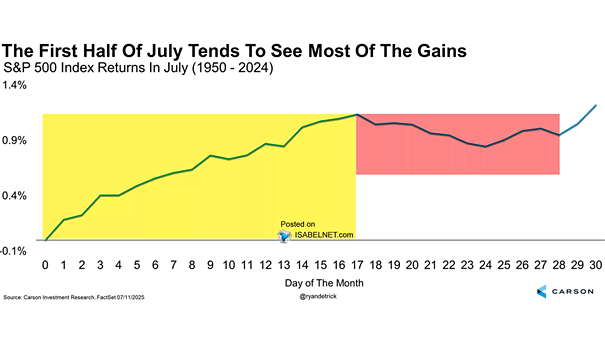
S&P 500 Index Returns in July
S&P 500 Index Returns in July Historically, July has shown strong performance in the U.S. stock market during its first half. The market often peaks on July 17, as investors take profits before the traditional summer slowdown. Image: Carson Investment Research