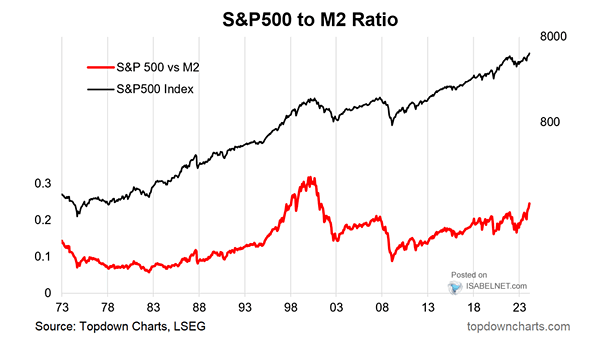
S&P 500 to M2 Ratio

S&P 500 to M2 Ratio The rising S&P 500 to M2 ratio suggests a potential overvaluation in the U.S. stock market. This trend implies greater demand for stocks compared to the supply of money, worrying investors and analysts. Image: Topdown Charts
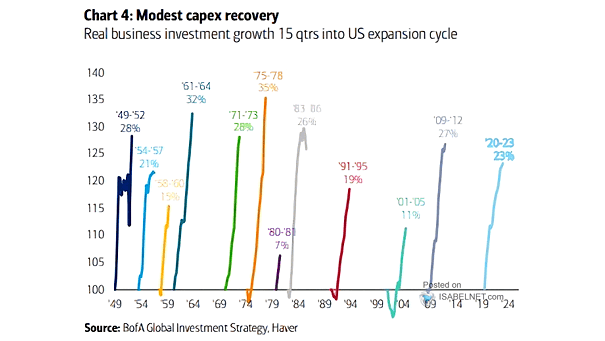
U.S. Real Business Investment

U.S. Real Business Investment While some companies have demonstrated high levels of capital expenditure in the United States, the overall trend remains modest since the 2020 recession. Image: BofA Global Investment Strategy

Typical Path of S&P 500 Bottom-Up Consensus EPS Estimate

Typical Path of S&P 500 Bottom-Up Consensus EPS Estimate S&P 500 EPS revisions for 2024 are showing a more favorable trend compared to both the previous year, 2023, and the average revisions seen historically, which could potentially contribute to a positive sentiment in the market. Image: Goldman Sachs Global Investment Research

S&P 500 Operating Margin

S&P 500 Operating Margin After the COVID-19 pandemic, the operating margins of companies in the S&P 500 have returned to a state of normalcy, leading to a positive trend of improved profitability and cash flows for these companies. Image: Morgan Stanley Wealth Management

Cumulative Cross Asset Flows in % of AUM Terms

Cumulative Asset Flows in % of AUM Terms In 2023, there has been a notable trend of strong inflows into “risk-free” assets, indicating a growing preference for low-risk investment options in an environment of higher yields. Image: Deutsche Bank Asset Allocation

U.S. M2 to Nominal GDP Ratio

U.S. M2 to Nominal GDP Ratio The return of the U.S. M2 to nominal GDP ratio to its long-term trend is a positive indicator. It reflects a healthier balance between money supply and economic output, fostering stability and sustainable growth in the economy. Image: Federal Reserve Bank of St. Louis

U.S. Economic Expansions and Recessions

U.S. Economic Expansions and Recessions There has been a general trend towards less frequent recessions in the United States over recent decades, which reflects the evolving nature of the U.S. economy and its resilience in the face of potential downturns Image: USAFacts

S&P 500 Free Cash Flow

S&P 500 Free Cash Flow Despite a decline, the S&P 500 free cash flow remains higher than the historical trend, even during the current hiking cycle. Image: BofA Research Investment Committee

S&P 500 – Election Year Seasonality

S&P 500 – Election Year Seasonality During election years, the S&P 500 tends to trend sideways in Q1. Investors are typically cautious about the potential outcomes of the upcoming elections and tend to adopt a more conservative approach. Image: MarketDesk Research