Leading Economic Indicators (LEI): U.S. vs. Global

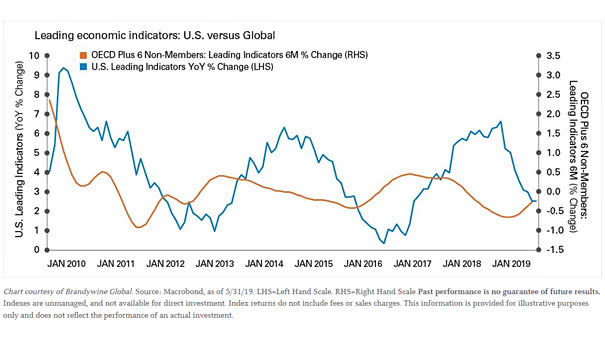
Leading Economic Indicators (LEI): U.S. vs. Global Leading economic indicators appear to be stabilizing, outside the United States. The central banks’ policy response could have a positive knock-on effect on global growth. Image: Legg Mason
History of the Real Federal Minimum Wage

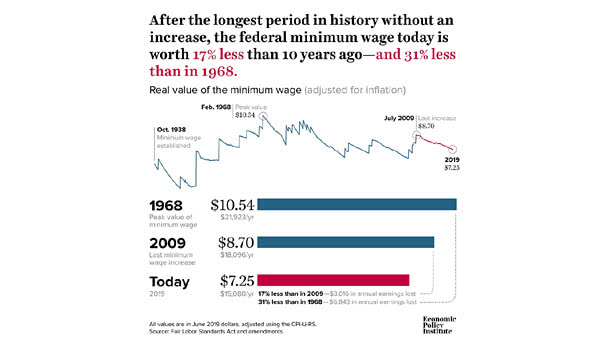
History of the Real Federal Minimum Wage Today, the real federal minimum wage is worth 31% less than in 1968. It is also the longest period without an increase (adjusted for inflation). You may also like “Wage Growth vs. U.S. Home Price Growth.” Image: Economic Policy Institute

What is the Biggest Risk Right Now for Investors?

What is the Biggest Risk Right Now for Investors? What is the Biggest Risk Right Now for Investors? The risk of a Fed policy error The probability of a Fed rate cut in July 2019 is now 84.6%. Image: Bloomberg

The Market is Almost Wrong about What the Fed Will Do

The Market is Almost Wrong about What the Fed Will Do Actually, the Fed decides when to raise rates. But the market decides when to cut rates: “Markets have accurately priced in cuts before easing cycles begin.” Keep in mind that rate cut expectations are highly predictive six months in advance. You may also like “Fed Policy…

Societe Generale’s Chart of Swan Risks

Societe Generale’s Chart of Swan Risks This chart shows the downside and upside risks to the growth outlook. Biggest risks (black swan): protectionism/trade wars (25%), and European policy uncertainty (20%) Image: Societe Generale Cross Asset Research

Markets Have Accurately Priced in Cuts before Easing Cycles Begin

Markets Have Accurately Priced in Cuts before Easing Cycles Begin Orange lines mark days when markets priced in a rate cut. In recent history, it occurs between 33 and 281 business days before fed cut. The average is 120 business days. So, the Fed’s rate cut could take place in September 2019. You may also…

What About the Predictive Power of the Fed?

What About the Predictive Power of the Fed? As former Fed policymaker Narayana Kocherlakota said in 2016: “Don’t rely on FOMC forecasts of future fed funds rates.” Why? Because the economy is often shaken by crises and does not evolve as expected. Image: Hedgeye Risk Management LLC

Yield Curve vs. Real Fed Funds Rate

Yield Curve vs. Real Fed Funds Rate In modern history, every recession was preceded by an inverted yield curve and high real interest rates. When an inverted yield curve occurs, short-term interest rates exceed long-term rates. It suggests that the long-term economic outlook is poor and that the yields offered by long-term fixed income securities will…

Real GDP vs. Real Fed Funds Rate

Real GDP vs. Real Fed Funds Rate One of our most favorite charts is the real GDP vs. the real Fed funds rate (adjusted for inflation). Historically, recessions begin when the real Fed Funds rate exceeds GDP growth. We are far from that today. So, this cycle should not end any time soon. Real Fed…

Real Fed Funds Rate

Real Fed Funds Rate Real Fed funds rate is a key indicative factor, because it’s a very good measure of how tight or loose monetary policy is. Real Fed funds rate is the “true cost” of borrowing money. Recessions have always been preceded by a substantial tightening of monetary policy, which, in real terms, matter…