S&P 500 and Leading Economic Index (LEI)
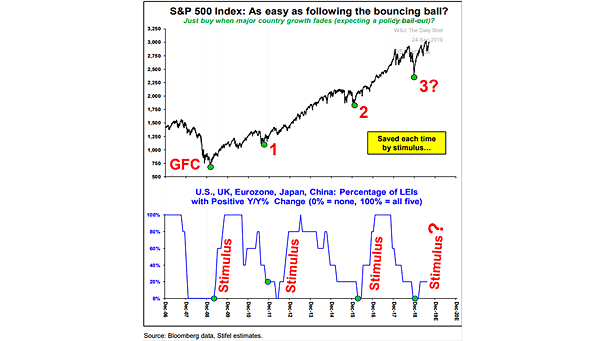
S&P 500 and Leading Economic Index (LEI) This chart shows that stimulus has saved the U.S. stock market each time. Saved once again? Image: Stifel
S&P 500 and Leading Economic Index (LEI) This chart shows that stimulus has saved the U.S. stock market each time. Saved once again? Image: Stifel
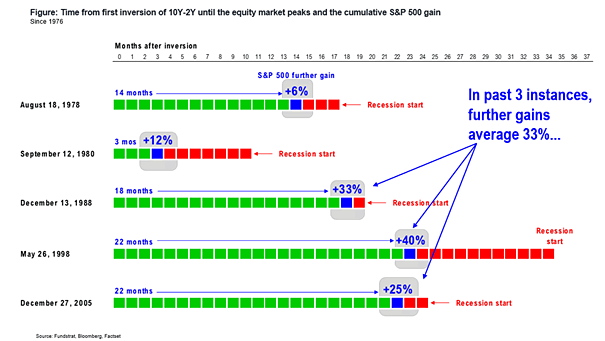
Time From First 10Y-2Y Yield Curve Inversion And S&P 500 Returns The S&P 500 tends to rise after an inverted yield curve. Last three 10Y-2Y curve inversions, further gains average 33%. Image: Fundstrat Global Advisors, LLC

S&P 500 Low Volatility Stocks Are the Best Performing Asset YTD This chart shows that S&P 500 low volatility stocks are the best performing asset year-to-date (outside of GSCI energy). Actually, high-quality stocks are a good way to protect against a weak economy. Image: Goldman Sachs Global Investment Research
The S&P 500 Hits All-Time High Bulls make money and are happy again… Yes, but until when? Keep in mind that the US stock market is currently overvalued by 9%. Image: Hedgeye Risk Management LLC