S&P 500 Index Quarterly Returns Based on the Four-Year Presidential Cycle

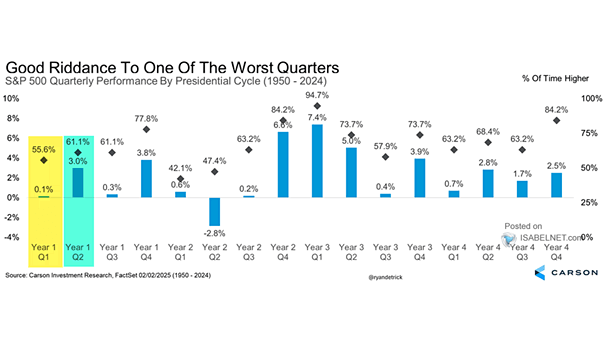
S&P 500 Index Quarterly Returns Based on the Four-Year Presidential Cycle The first quarter of an election year often exhibits a sluggish performance for the S&P 500 index, but as the year progresses, the market tends to regain strength, ultimately delivering a solid performance. Image: Carson Investment Research
Magnificent 7 Price Return

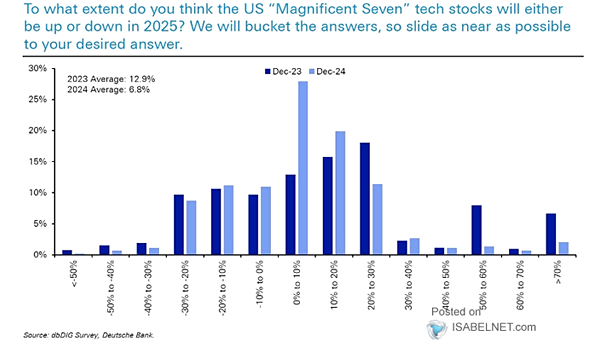
Magnificent 7 Price Return In light of the current market trends and considering the historical performance of America’s magnificent seven stocks, it would not be surprising to see these stocks continue to perform well in 2024. Image: Deutsche Bank

S&P 500 vs. Its Seasonal Pattern

S&P 500 vs. Its Seasonal Pattern While past performance does not guarantee future results, can the U.S. stock market continue to follow its seasonal pattern? Image: Topdown Charts

Nasdaq 100 vs. 10-Year U.S. TIPS Yield (Inverted)

Nasdaq 100 vs. 10-Year U.S. TIPS Yield (Inverted) The Nasdaq 100 has shown strong performance despite the rise in real yields, which may indicate the possibility of the market overheating. Image: The Daily Shot

When Treasury Inflation-Protected Securities (TIPS) Outperform?​

When Treasury Inflation-Protected Securities (TIPS) Outperform? The chart shows that Treasury Inflation-Protected Securities (TIPS) usually outperform regular Treasuries when the 10-year breakeven inflation rate is below 2%. The 10-year breakeven inflation rate is a market-based measure of expected inflation over the next 10 years. Image: Movement Capital LLC

U.S. Equities and The World: Earnings Growth vs. Multiple Expansion

U.S. Equities and The World: Earnings Growth vs. Multiple Expansion Since the 2009 low, the strong performance of the U.S. markets comes from earnings growth (73%) and multiple expansion (27%). You may also like “S&P 500 Return: Earnings Growth vs. Multiple Expansion.” Image: Goldman Sachs Global Investment Research