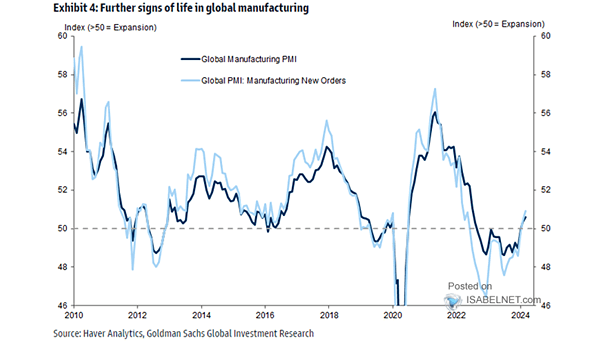
Performance – U.S. vs. Japan Equities
Performance – U.S. vs. Japan Equities Since January 2022, Japan equities have outperformed their U.S. counterparts. Will this trend persist going forward? Image: BofA Global Investment Strategy
Median Sector Returns in the Year Before U.S. Election Day Given the historical trend of the tech sector underperforming the S&P 500 in the year preceding the U.S. election day, should investors consider underweighting their exposure to the tech sector in their portfolios? Image: Goldman Sachs Global Investment Research
S&P 500 Performance When Down In October, But Still Positive YTD When the S&P 500 declines in October but maintains a positive performance since the beginning of the year, historical trends suggest that the last two months of the year tend to show positive returns. Image: Carson Investment Research
Global Central Bank Balance Sheets The ongoing trend of central banks purchasing global debt since 2008, will depend on dynamic economic conditions, inflationary forces, and the specific monetary policy goals of each individual central bank. Image: Real Investment Advice
Cycle – U.S. Regimes The U.S. regime indicator remains in the recovery phase, which suggests that there are positive signs and trends indicating improvement. Image: BofA US Equity & Quant Strategy
Sentiment – S&P 500 Performance After CBOE Put/Call Ratio Spikes of > 1.5 As a contrarian indicator, a high put/call ratio can be interpreted as a signal that the market may be nearing a bottom, or that a trend reversal may be imminent. Image: Carson Investment Research
S&P 500 Index, Number of Consecutive Days Closed Within 2% of 50-Day Moving Average When the S&P 500 index trades in a narrow range and stays close to the 50-day moving average for an extended period of time, it can indicate indecision or a lack of a clear trend in the market. Image: Morgan Stanley…
S&P 500 Performance When Up YTD Between 10-20% At the End of September When the S&P 500 is up year-to-date between 10-20% at the end of September, the fourth quarter tends to be bullish. Historical trends are not a guarantee of future performance, but they can provide useful insights for investors and traders when making…
Average U.S. 10-Year Treasury Yield Move Before and After the Last Fed Hike in the Cycle Historically, after the last Fed rate hike, U.S. 10-year Treasury yields have tended to trend lower on average. Image: Deutsche Bank
China and Mexico as % of U.S. Imports For the first time since 2003, the United States currently imports more goods from Mexico than from China. Will this trend continue? Image: BofA Global Investment Strategy