How to Double your Money in the Market

How to Double your Money in the Market In this video, Josh Brown, financial advisor at Ritholtz Wealth Management LLC, explains why the power of compounding can help you double your money. You may also like “The Long-Term Impact of Compounded Returns” and why Albert Einstein said “Compound Interest Is the Eighth Wonder of the World.”…

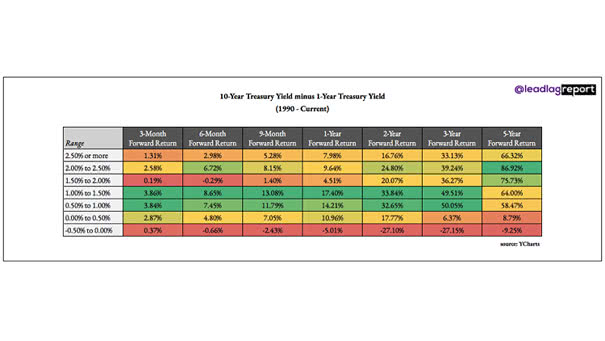
10-Year Treasury minus 1-Year Treasury Yield Spread vs. S&P 500 Returns

10-Year Treasury minus 1-Year Treasury Yield Spread vs. S&P 500 Returns If history helps us to predict the future, the 10y-1y treasury yield spread suggests low returns ahead for U.S. stocks. After 10 years of a bull market, our stock market forecasting model also shows that the market follows a different path in 2019. Statistically,…

Stock Market Forecasting Models vs. US Stock Market

Stock Market Forecasting Models vs. US Stock Market – Growth of $1,000 As an example, the chart shows the growth of $1,000 since 1970, between the stock market forecasting models and the US stock market (compound return before taxes, fees and transactions costs – unleveraged, simulated long & short trades – quarterly basis & logarithmic…

The Average American Investor Still Underperforms the Market Over the Long Term

The Average American Investor Still Underperforms the Market Over the Long Term This is usually due to emotional biases, herding effect, lack of diversification, panic selling,… Most investors buy high and sell low at the wrong time. That’s the reason why using our formidable decision support tools will empower yourself to make much better investment…

Vanguard Founder Jack Bogle’s Market Forecast

Vanguard Founder Jack Bogle’s Market Forecast Vanguard Founder Jack Bogle has done more for the average investor than any person in the financial industry. By the end of 2018, he tells us why he thinks returns will be lower in the coming years. https://www.youtube.com/watch?v=x5fX0CdESMk

Stock Market Bull and Bear Indicator

This powerful indicator looks into the US stock market and suggests whether it is bullish, bearish or neutral Using multiple financial data, this great model helps investors navigate through different market conditions. It suggests whether the US stock market tendency is bullish, bearish or neutral. It is a contrarian indicator. A bullish signal suggests that…

Stock Market Long-Term Forecast

https://www.isabelnet.com/wp-content/uploads/2019/03/stock-market-long-term-forecast.mp4 This great long-term forecast model displays the annual and total return expected for the next 10 years with a high degree of confidence This advanced model makes a forecast for the next 12 months, next 3 years, next 5 years, and next 10 years, with dividends reinvested. For each period, it displays the annual…

Stock Market Equity Risk Premium

https://www.isabelnet.com/wp-content/uploads/2019/03/stock-market-equity-risk-premium.mp4 This fabulous model shows if the US stock market return for the next 10 years is more or less attractive than the 10-Year Treasury Note The US stock market equity risk premium is the US stock market excess return for the next 10 years over the US 10-year Treasury Note. This is the premium…

S&P 500 – CAPE Valuations

S&P 500 – CAPE Valuations While a high CAPE ratio can persist for extended periods without triggering a market correction, historical data suggests that such periods of elevated valuations are typically followed by lower stock market returns. Image: Real Investment Advice