Inflation – U.S. PCE Price Index
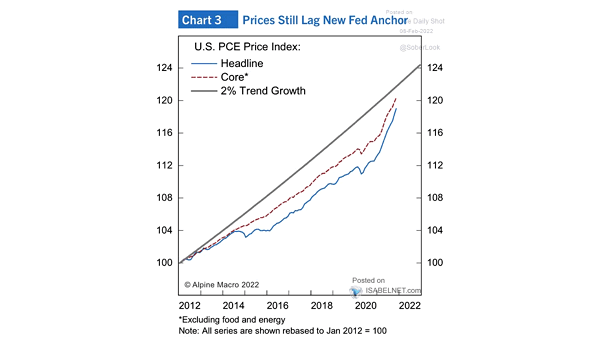
Inflation – U.S. PCE Price Index Despite inflation worries, U.S. PCE inflation remains below what a 2% trend would have done since 2012. Image: Alpine Macro
Inflation – U.S. PCE Price Index Despite inflation worries, U.S. PCE inflation remains below what a 2% trend would have done since 2012. Image: Alpine Macro
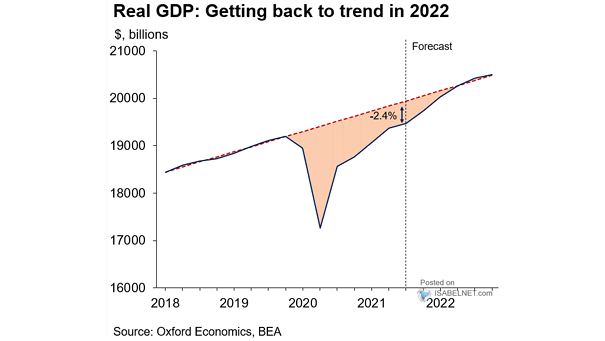
U.S. Real GDP U.S. real GDP is expected to reach the pre-crisis trend in 2022. Image: Oxford Economics

Copper YoY Change vs. ISM New Orders YoY Change ISM new orders trends point to a decline in copper prices. Image: BofA Global Investment Strategy
Bonds and Correlations – 30-Year Treasury Yield The U.S. 30-year Treasury yield correlates with many intra-equity trends. Image: Alpine Macro
Implied Equity Allocation by U.S. Households Periods of high household equity allocation have historically been followed by lower market returns, implying that current trends might indicate potential risks for future investors. Image: J.P. Morgan
U.S. Consumer Sentiment and U.S. Unemployment Rate Consumer sentiment is a good leading indicator of the trend in the unemployment rate. Image: J.P. Morgan Asset Management
S&P 500 and the 14-Day RSI Lower highs signal a bearish divergence on the 14-day relative strength index. Is a trend change imminent for the S&P 500? Image: BofA Global Research
U.S. GDP Forecast – Return to Pre-COVID-19 GDP Path Morgan Stanley expects U.S. GDP to reach its pre-COVID-19 GDP trend by 3Q21 and then rise above it. Image: Morgan Stanley Research
EUR/USD and Relative Growth Expectations (EMU vs. U.S.) Will the current EUR/USD trend eventually reverse, as the U.S. is expected to outperform Europe? Image: Nordea and Macrobond
U.S. 10-Year Note Yield – Reaction to Global Slowdowns Since 1960 Global slowdowns do not occur often. The U.S. 10-year Treasury note yield is currently following the average historical trend. Image: Arbor Research & Trading LLC