New Path of the S&P 500 Market in 2020
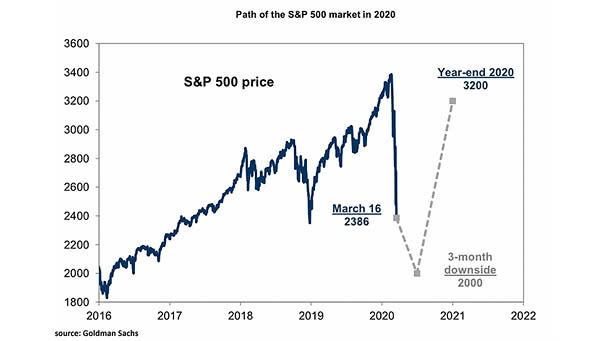
New Path of the S&P 500 Market in 2020 Goldman Sachs has set a price target of 3200 by the end of 2020, and a new mid-year S&P 500 target of 2000. Image: Goldman Sachs Global Investment Research
New Path of the S&P 500 Market in 2020 Goldman Sachs has set a price target of 3200 by the end of 2020, and a new mid-year S&P 500 target of 2000. Image: Goldman Sachs Global Investment Research
Path of the S&P 500 Market in 2020 Goldman Sachs has set a price target of 3200 by the end of 2020, and a mid-year S&P 500 target of 2450 (28% below the market peak). Image: Goldman Sachs Global Investment Research

S&P 500 and VIX/10-Year U.S. Treasury Ratio Chart showing how spikes in the VIX/10-Year U.S. Treasury ratio result in lower equity prices. Image: Truist
Forecast: Path of the S&P 500 in 2020 Goldman Sachs sees limited upside for the S&P 500 from current levels and set a price target of 3400 by the end of 2020. Image: Goldman Sachs
S&P 500 Valuation Multiples The price-to-sales ratio of the S&P 500 Index suggests that stocks are as expensive as they were during the Internet bubble. The P/E ratio also remains at high level. Image: Tomasz Hońdo
S&P 500 Forecast for 2020 Goldman Sachs forecasts a price-target for the S&P 500 at 3400 by year-end 2020, and a downside scenario at 2600 depending on tariffs and the US election result. Image: Goldman Sachs
U.S. ISM Manufacturing Index vs. S&P 500 Chart showing that the S&P 500 continues to price in a strong rebound in the ISM, from 49 to 54 (R = 0.62). Image: Deutsche Bank Global Research
S&P 500 Forecast for 2019 Goldman Sachs is holding its year-end price-target for the S&P 500 at 3100, and its downside scenario at 2620 (as of August 23, 2019). Image: Goldman Sachs Global Investment Research
Spread Between 10-ROC of S&P 500 and Treasury Bonds This interesting chart shows a 10 trading day rate-of-change (ROC) for the SP500 and for near-month Treasury bond futures prices. A price low is forming now. Image: McClellan Financial Publications, Inc.
Investor Movement Index vs. S&P 500 The Investor Movement Index indicates the sentiment of TD Ameritrade retail investors. Thus, retail investors are net buyers of equities when the stock market is expensive, and they are net sellers of equities when the stock market is cheap. As usual, retail investors react to equity price movements. They buy and sell…