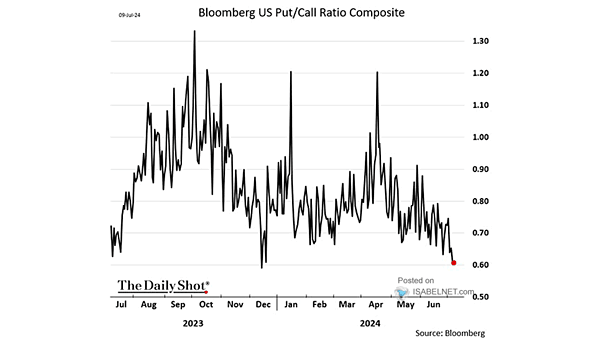
Sentiment – U.S. Put Call Ratio Composite

Sentiment – U.S. Put Call Ratio Composite A relatively low put/call ratio is often interpreted as a sign of heightened bullish sentiment or greed in the market, which is frequently viewed as a contrarian indicator. Image: The Daily Shot
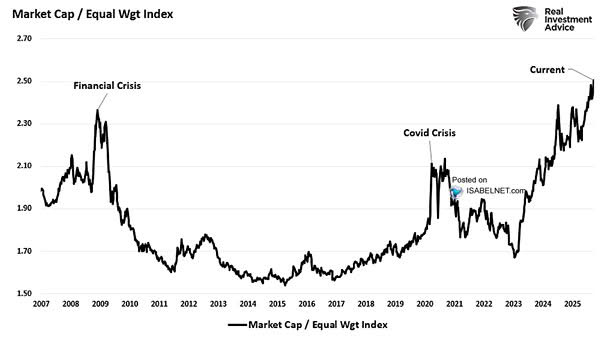
S&P 500 Cap-Weight vs. Equal-Weight Return

Cap-Weighted S&P 500 vs. Equal-Weighted S&P 500 The S&P 500 equal-weighted index has a more attractive valuation and potential for broader profit growth, suggesting it could outperform the S&P 500 market-cap weighted index in the near future. Image: Goldman Sachs Global Investment Research

Sentiment/VIX Composite vs. S&P 500

Sentiment/VIX Composite vs. S&P 500 Current levels of the Sentiment/VIX Composite Index are more indicative of near-term market peaks than the beginning of a bullish trend. Image: Real Investment Advice

U.S. 10-Year Treasury Yield

U.S. 10-Year Treasury Yield The 10-year U.S. Treasury yield has been in a secular bear market since February 2022, and it could potentially approach 6% in the coming years. Image: BofA Global Research

S&P 500 and the Percentage of Stocks Above 10-Day MAs

S&P 500 and the Percentage of Stocks Above 10-Day MAs The rise in the percentage of S&P 500 stocks above their 10-day moving averages can be interpreted as a tactical bullish divergence, providing valuable insights into market strength and the potential for a reversal. Image: BofA Global Research

Performance – Semiconductors vs. S&P 500

Performance – Semiconductors vs. S&P 500 The relative outperformance of semiconductor stocks compared to the S&P 500 has surged to its highest level since March 2000, indicating a bullish momentum that bodes well for the broader market. Image: BofA Global Investment Strategy

S&P 500 – Margin Debt vs. Long-Term Trend

S&P 500 – Margin Debt vs. Long-Term Trend A rise in the ratio of margin debt to the S&P 500 market cap could indicate a bullish outlook for the U.S. stock market, potentially signaling confidence in the market’s upward trajectory. Image: Topdown Charts

Median Policy Rate Projections in the Fed’s Summary of Economic Projections

Median Policy Rate Projections in the Fed’s Summary of Economic Projections The anticipation of rate cuts in 2024 and beyond is generally viewed as bullish for equity markets, as it signals a potential easing of monetary policy that can support economic growth and stock prices. Image: BofA Global Research

10-Year U.S. Treasury Yield

10-Year U.S. Treasury Yield U.S. yields are likely to be lower in 2024, which could potentially support a cyclical bull bond market. Image: BofA Global Investment Strategy

S&P 500 Index Returns in November

S&P 500 Index Returns in November Historically, the last week of November tends to be bullish for U.S. stocks, suggesting positive market sentiment and upward stock price trends during this specific period. Image: Carson Investment Research