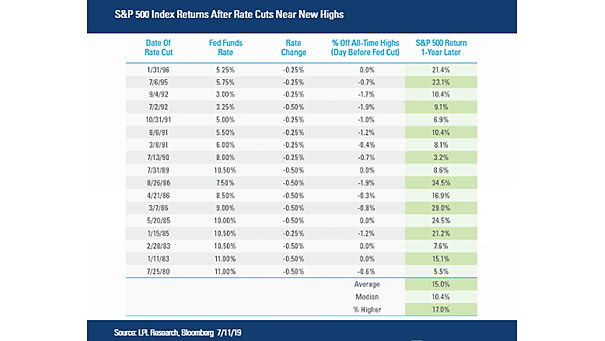
S&P 500 Index Returns After Fed Rate Cuts Near New Highs
S&P 500 Index Returns After Fed Rate Cuts Near New Highs The adage of “don’t fight the Fed” may be too simplistic, but usually, the market doesn’t care too much about other things, as long as the Fed stays dovish. Image: LPL Research