S&P 500 Price Return and S&P 500 as Reported EPS
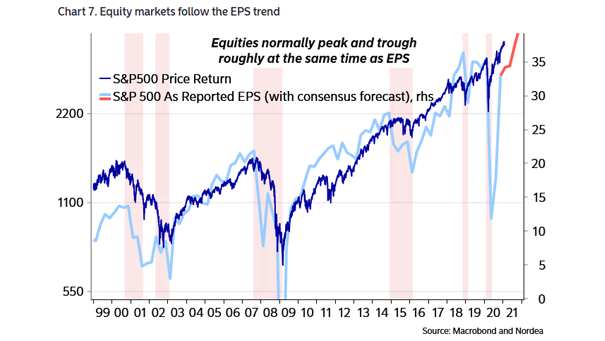
S&P 500 Price Return and S&P 500 as Reported EPS Equity markets tend to follow the EPS trend. Image: Nordea and Macrobond
S&P 500 Price Return and S&P 500 as Reported EPS Equity markets tend to follow the EPS trend. Image: Nordea and Macrobond
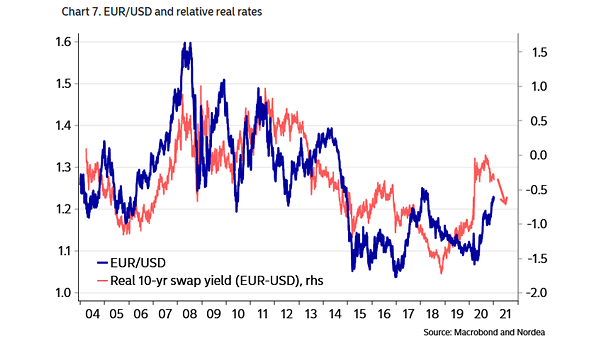
Euro to U.S. Dollar (EUR/USD) and Relative Real Rates Will the current EUR/USD trend stop and eventually reverse? Image: Nordea and Macrobond

Number of S&P 500 Stocks Contributing to Market Gains in 2020 464 stocks in the S&P 500 closed positively in November. Will the trend continue in December? Image: Statista
U.S. Interest Rates – Velocity of MZM Money Stock and Natural Rate of Interest Should investors expect low interest rates for a long period of time? This chart helps to explain the secular trend for U.S. interest rates. Image: Fidelity Investments
Buybacks – Announced Share Repurchases for S&P 500 Companies S&P 500 buybacks fell to $88.7 billion in the second quarter. The trend is expected to continue in the third quarter. Image: J.P. Morgan
Performance of S&P 500 Megacap Growth Stocks vs. Rest of S&P 500 The relative performance of S&P 500 megacap growth stocks remains within its year-to-date trend channel, despite the recent selloff. Image: Deutsche Bank Asset Allocation
Long-Term Bullish S&P 500 View A view of sector rotation suggests a long-term bullish trend for the S&P 500. Image: BofA Global Research
Real Interest Rates Since 1314 Since 1314, real interest rates have been on a long-term downward trend. Image: Goldman Sachs Global Investment Research
World Tech + E-commerce vs. World ex-Tech & E-commerce The secular trend in the market has been deflation (credit & tech) dominating inflation, as $100 of EPS in 1995 is now $1,500 in the technology sector, but only $425 in everything else. Image: BofA Global Investment Strategy
Trade Globalization Will the coronavirus pandemic add momentum to the deglobalization trend? Image: BCA Research