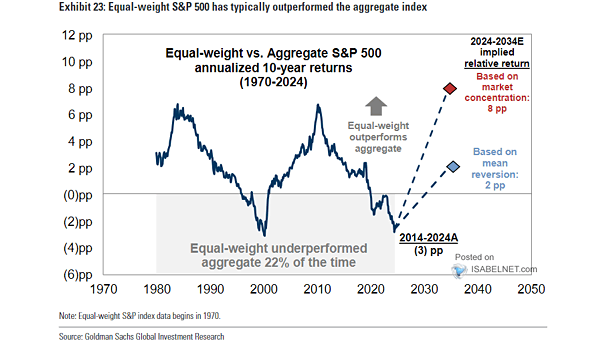
Equal-Weight vs. Aggregate S&P 500 10-Year Trailing Relative Returns

Equal-Weight vs. Aggregate S&P 500 10-Year Trailing Relative Returns Current market conditions suggest that investors might benefit from considering an equal-weight strategy for the S&P 500, especially in light of the significant concentration observed in the index. Image: Goldman Sachs Global Investment Research
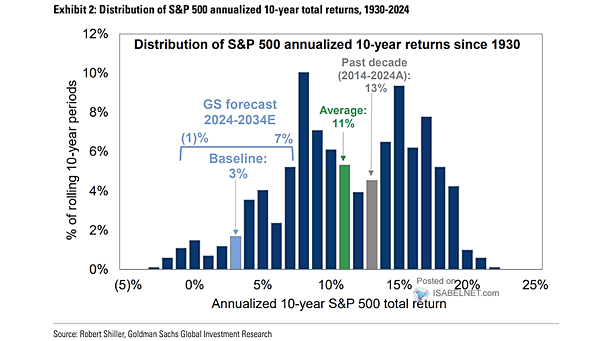
Distribution of 10-Year S&P 500 Annualized Returns

Distribution of 10-Year S&P 500 Annualized Returns Goldman Sachs projects a modest average annualized total return of 3% for the S&P 500 over the next decade, considerably below historical averages, reflecting concerns about high equity valuations. Image: Goldman Sachs Global Investment Research

S&P 500 Annualized 10-Year Total Return Forecasts

S&P 500 Annualized 10-Year Total Return Forecasts Goldman Sachs expects the S&P 500 to deliver an average annualized total return of 3% during the next 10 years, significantly below historical averages. This forecast reflects concerns over high equity valuations. Image: Goldman Sachs Global Investment Research

Cyclicals vs. Defensives Performance and U.S. 10-Year Treasury Yield

Cyclicals vs. Defensives Performance and U.S. 10-Year Treasury Yield The rise in yields is confirming the relative strength of U.S. cyclical stocks as they respond positively to favorable economic indicators while U.S. defensive stocks face pressure. Image: Morgan Stanley Research

10-Year U.S. Treasury Yield Macro Fair Value

10-Year U.S. Treasury Yield Macro Fair Value BofA’s macroeconomic framework estimates the fair value of the 10-year U.S. Treasury yield to be between 4.10% and 4.15%, with a year-end target of 3.75%. Image: BofA Global Research

Commodities Rolling 10-Year Annualized Returns

Commodities Rolling 10-Year Annualized Returns Historically, commodity bull markets have lasted for extended periods, often a decade or more, and have the potential to generate substantial returns for investors who maintain their exposure throughout the cycle. Image: BofA Global Investment Strategy

U.S. ISM Manufacturing PMI vs. 10-Year U.S. Treasury Yield

U.S. ISM Manufacturing PMI vs. 10-Year U.S. Treasury Yield Easing rate pressure is projected to facilitate a recovery in U.S. manufacturing as financial conditions improve, inflation declines, and both domestic and foreign demand strengthen. Image: BofA US Equity & Quant Strategy

U.S. Rates – 2-Year and 10-Year Treasury Yield Forecasts

U.S. Rates – 2-Year and 10-Year Treasury Yield Forecasts BofA forecasts the 10-year UST yield at 3.75% by year-end 2024, suggesting the possibility of a downward trend in borrowing costs, particularly if inflation continues to moderate and economic growth slows. Image: BofA Global Research

U.S. CPI Inflation vs. U.S. 10-Year Bond Yield

U.S. CPI Inflation vs. U.S. 10-Year Bond Yield CPI dynamics in early 2024 show a clear pattern: Q1’s higher inflation prompted increased Fed scrutiny, while Q2’s declines suggest potential interest rate cuts, impacting market expectations and U.S. Treasury yields on CPI days. Image: BofA Global Research

10-Year/2-Year Treasury Yield Curve Around First Fed Rate Cuts

10-Year/2-Year Treasury Yield Curve Around First Fed Rate Cuts The U.S. yield curve typically steepens once the prospect of interest rate cuts by the Fed becomes more imminent, rather than when the Fed actually stops hiking rates. Image: Goldman Sachs Global Investment Research