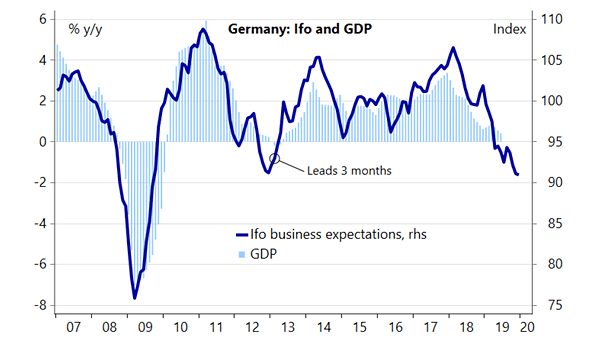
Ifo Business Expectations Index Lead German GDP
Ifo Business Expectations Index Lead German GDP Chart suggesting that the Ifo Business Expectations Index leads German GDP by 3 months. Image: Nordea and Macrobond
Ifo Business Expectations Index Lead German GDP Chart suggesting that the Ifo Business Expectations Index leads German GDP by 3 months. Image: Nordea and Macrobond
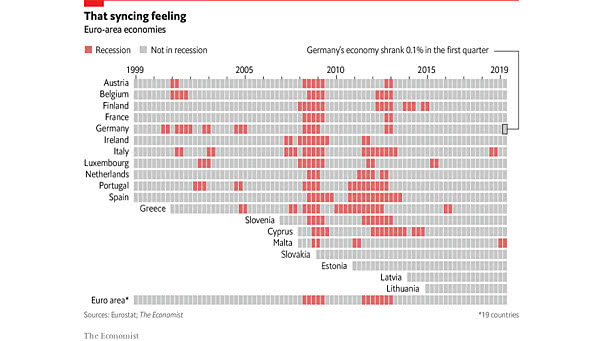
Fears of a German Recession Are Rising A recession in Germany could mean economic damage across the region. Image: The Economist

Germany – Explaining 10-Year Bund Yields This great chart suggests that demographics explain Germany’s 10-year bund yields. An R² of 0.87 is quite high and significant. Image: Arbor Research & Trading LLC
U.S./German 2-Year Yield Spread vs. U.S./Euro Foreign Exchange Rate This chart shows the Euro vs. US Dollar (EUR/USD) and how a wider U.S./German 2-year yield spread corresponds to a stronger US dollar. R² = 0.62 since 2005.
Germany: GDP Growth Composition Since 2013 In 2019Q1, there is a slight rebound in the German economy but the outlook remains gloomy. Image: Oxford Economics
DAX vs. S&P 500 Despite the German economy contracting for the second consecutive year, the DAX has shown impressive performance, highlighting the disconnect between stock market gains and economic realities. Image: Goldman Sachs Global Investment Research
Gold Reserves by Country The United States has the largest gold reserve, followed by Germany. Image: IMF
G3 Real Core Retail Sales Since 2019, real core retail sales in the United States have risen significantly, while Germany has seen stagnant growth and Japan has witnessed a decline, reflecting differing economic conditions and consumer behaviors. Image: BofA Global Research
U.S. 10-Year Treasury Yield vs. 10-Year Bund Yield It is becoming more common for German bund yields to be below U.S. yields, which can be attributed to the difference in economic conditions and fiscal policies between Germany and the United States. Image: Gavekal, Macrobond
Nominal GDP – World’s 10 Biggest Economies in 2020 The United States, China, Japan, Germany and the United Kingdom are the five largest economies in the world. Image: CNBC
10-Year Real Yields Across Regions This chart highlights the recent sharp decline of 10-year real yields in the U.S., the U.K. and Germany. Image: Goldman Sachs Global Investment Research