MSCI All Country World Index (ACWI) Leads Global GDP
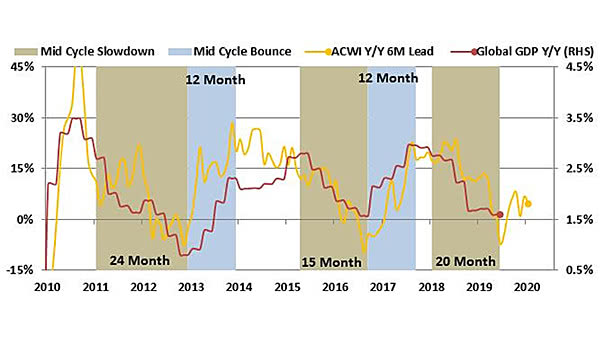
MSCI All Country World Index (ACWI) Leads Global GDP This chart suggests that the MSCI All Country World Index (ACWI) leads Global GDP by 6 months. Image: Ken Fisher
MSCI All Country World Index (ACWI) Leads Global GDP This chart suggests that the MSCI All Country World Index (ACWI) leads Global GDP by 6 months. Image: Ken Fisher
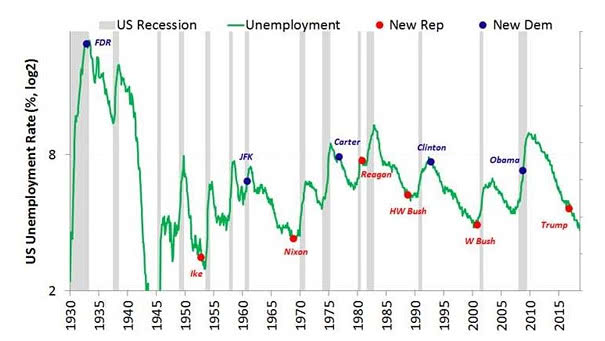
Unemployment and U.S. Presidential Elections Americans tend to elect Democrats when unemployment is high, and Republicans when unemployment is low. Image: Ken Fisher

“Yield Curve” Google Trends vs. 10Y-3M Yield Spread This interesting chart shows the Google trends interest for the “yield curve” compared to the U.S. 10-year minus 3-month Treasury yield spread. If history helps us predict the future, the next market peak could be in 2021 or later, maybe. Image: Ken Fisher
Who Has the Most To Lose in US-China Trade War? The tariffs are no threat and China has more to lose economically in a trade war. Those numbers are estimates but in reality wrong ones and far too high, according to Ken Fisher. Image: Oxford Economics
Advanced Stock Market Forecast 96% Correlation since 1970 Stock Market Valuation Short- and Long-Term Forecasts Bull and Bear Indicator Equity Risk Premium R² = 0.94 since 1970 For Professionals and Individuals View More Subscribe Now! Check out our Stock Market Forecasting Models “Your results are very interesting” Howard Marks Legendary investor Our Features Five Advanced…