Nasdaq 100 vs. 10-Year U.S. TIPS Yield (Inverted)

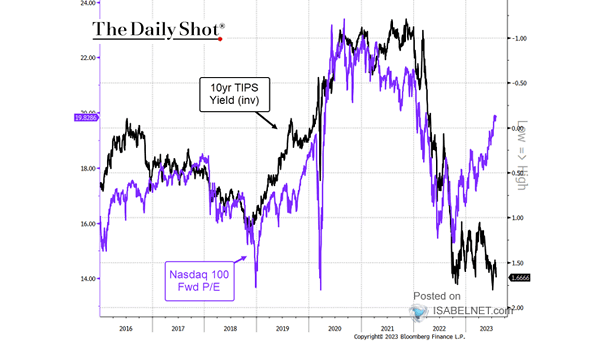
Nasdaq 100 vs. 10-Year U.S. TIPS Yield (Inverted) The Nasdaq 100 has shown strong performance despite the rise in real yields, which may indicate the possibility of the market overheating. Image: The Daily Shot
Nasdaq 100 Technicals

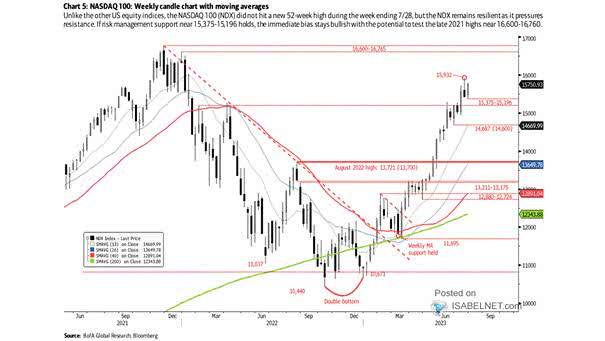
Nasdaq 100 Technicals The Nasdaq 100 remains resilient so far. Image: BofA Global Research

Nasdaq 100 Seasonality

Nasdaq 100 Seasonality Historically, July tends to be a good month for the Nasdaq 100 index, with seasonal patterns showing positive performance. Image: Goldman Sachs Global Investment Research

Relative Performance – Nasdaq 100 vs. Russell 2000

Relative Performance – Nasdaq 100 vs. Russell 2000 The frenzy surrounding artificial intelligence is driving U.S. tech stocks back to high levels relative to small caps. Image: BofA Global Research

Seasonality – Nasdaq Monthly Returns

Seasonality – Nasdaq Monthly Returns Seasonality is very useful for assessing probabilities, not certainties. This is one factor that can impact the Nasdaq price. Image: Goldman Sachs Global Investment Research