S&P 500 Index Quarterly Returns Based on the Four-Year Presidential Cycle

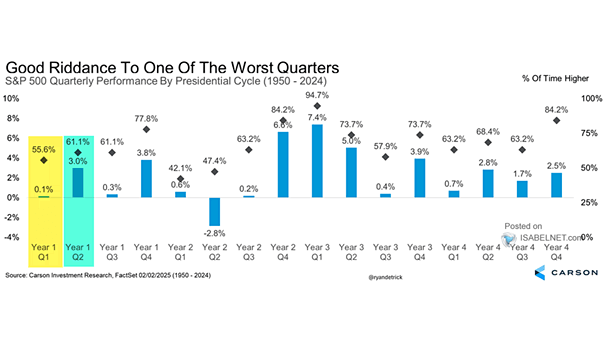
S&P 500 Index Quarterly Returns Based on the Four-Year Presidential Cycle The first quarter of an election year often exhibits a sluggish performance for the S&P 500 index, but as the year progresses, the market tends to regain strength, ultimately delivering a solid performance. Image: Carson Investment Research

Average S&P 500 Returns by Election Cycle Year

Average S&P 500 Returns by Election Cycle Year The dynamics and uncertainties of the electoral process often impact market performance in presidential election years, leading to a historical trend of weaker S&P 500 returns. Image: Goldman Sachs Global Investment Research
S&P 500 – Monthly Seasonality for Year 3 of the Presidential Cycle

S&P 500 – Monthly Seasonality for Year 3 of the Presidential Cycle Investors and traders can gain valuable insights from historical trends. In the third year of the presidential cycle, December has historically been a strong month for U.S. stocks. Image: BofA Global Research

S&P 500 Price Returns by Year of Presidential Cycle

S&P 500 Price Returns by Year of Presidential Cycle While the fourth year of the presidential cycle has historically been favorable for the U.S. stock market, it tends to have lower returns compared to the third year. Image: Goldman Sachs Global Investment Research
S&P 500 Performance per Year of a 4-Year Presidential Cycle

S&P 500 Performance per Year of a 4-Year Presidential Cycle Based on historical data, it is generally observed that the fourth year of a new president’s term typically shows robust performance in U.S. stocks, which can be seen as encouraging for investors. Image: Carson Investment Research

S&P 500 Returns Around the End of Fed Hiking Cycles

S&P 500 Returns Around the End of Fed Hiking Cycles In recent history, U.S. stocks tend to rally if there is no recession following the end of Fed hiking cycles. Image: Goldman Sachs Global Investment Research