Median S&P 500 Price Return After >25% Drawdown
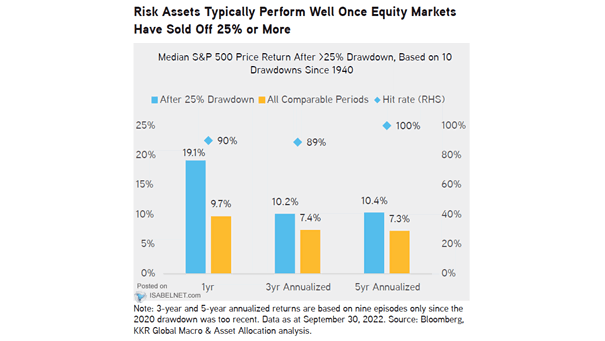
Median S&P 500 Price Return After >25% Drawdown Should long-term investors add more risk to a diversified portfolio? Image: KKR & Co.
Median S&P 500 Price Return After >25% Drawdown Should long-term investors add more risk to a diversified portfolio? Image: KKR & Co.
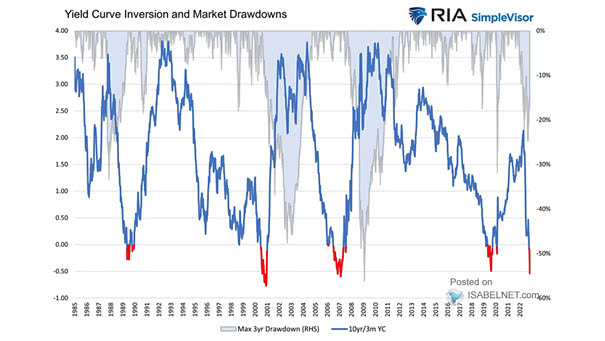
U.S. Yield Curve Inversion and Market Drawdowns The U.S. stock market is expected to bottom out well after the 10Y-3M yield curve un-inverts. Image: Real Investment Advice

S&P 500 Drawdown from 52-Week High and S&P 500 Performance 1-Year Later Historically, the S&P 500 has been positive one year after a 33% decline from 52-week high. Image: Charles Schwab
U.S. Net Equity Future Positions of Asset Managers and Drawdown > 10% When will the U.S. equity bear market be over? Image: Goldman Sachs Global Investment Research
S&P 500 Median Forward EPS Drawdowns The risk to U.S. equities remains earnings, as an earnings recession is not priced in. Image: Morgan Stanley Research
S&P 500 Drawdown Is the S&P 500 predicting a U.S. recession, as the Fed is more aggressive than expected? Image: The Daily Shot
S&P 500 Drawdowns From 2 Year Highs Do investors have the courage to invest in U.S. stocks right now? Image: Fidelity Investments
Nasdaq Composite Drawdown The Nasdaq Index is now in a 27% drawdown. Image: The Daily Shot
Returns – 20+ Year Treasury Bond ETF Drawdown Should investors consider long-maturity Treasuries after the market selloff? Image: The Daily Shot
Bear Markets – 30-Year U.S. Treasury Drawdown Will the U.S. Treasury bond market continue to sell off? Image: BofA ETF Research
U.S. Treasury Drawdown from Prior Highs Will the U.S. bond market continue to sell off? Image: BofA CEF Research