S&P 500 Monthly Returns During an U.S. Election Year

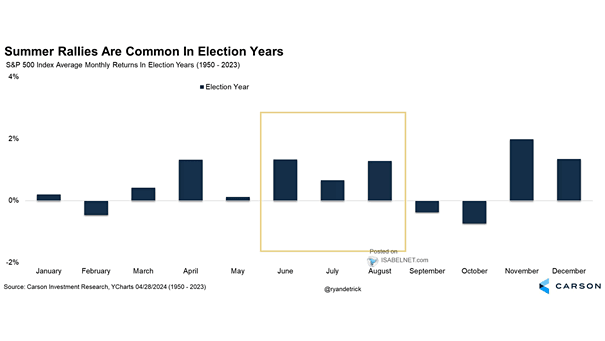
S&P 500 Monthly Returns During an U.S. Election Year The S&P 500 has historically performed well in August during presidential election years, contributing to an overall positive market sentiment and potentially extending the summer rally. Image: Carson Investment Research
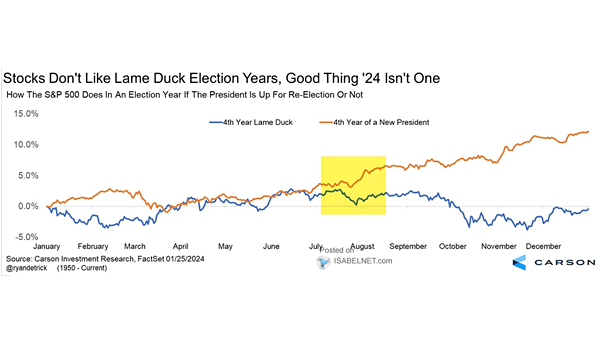
Implied Probabilities for the U.S. Presidential Election

Implied Probabilities for the U.S. Presidential Election The prediction markets are suggesting a high probability of a Republican sweep in the upcoming 2024 U.S. elections, with potentially far-reaching implications for the political landscape. Image: Goldman Sachs Global Investment Research

S&P 500 3-Month Performance During an Election Year

S&P 500 3-Month Performance During an Election Year In Presidential election years, June to August stands out as the strongest 3-month period of the year. The S&P 500 has been up 75% of the time, with an average return of 7.3% since 1928. Image: Carson Investment Research

How the S&P 500 Performance After Big Starts to Previous Election Years

How the S&P 500 Performance After Big Starts to Previous Election Years After a strong start to the election year, the U.S. stock market tends to regain momentum towards the end of Q2 and generally continues to perform well until the end of the year. Image: Carson Investment Research

S&P 500 – Election Year Seasonality

S&P 500 – Election Year Seasonality During election years, the S&P 500 tends to trend sideways in Q1. Investors are typically cautious about the potential outcomes of the upcoming elections and tend to adopt a more conservative approach. Image: MarketDesk Research

Average S&P 500 Returns by Election Cycle Year

Average S&P 500 Returns by Election Cycle Year The dynamics and uncertainties of the electoral process often impact market performance in presidential election years, leading to a historical trend of weaker S&P 500 returns. Image: Goldman Sachs Global Investment Research