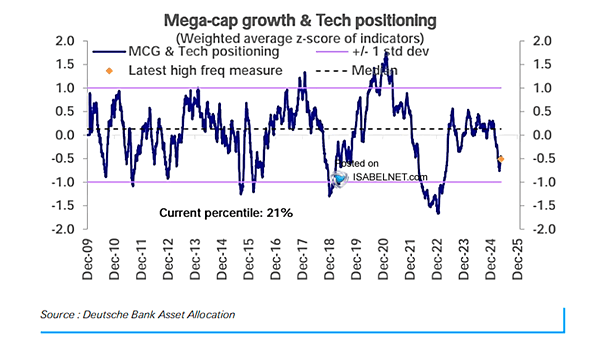
Mega-Cap Growth & Tech Positioning

Mega-Cap Growth & Tech Positioning The positioning of mega-cap growth and tech stocks in the 83rd percentile indicates strong interest from market participants, primarily driven by their potential for growth and market leadership. Image: Deutsche Bank Asset Allocation
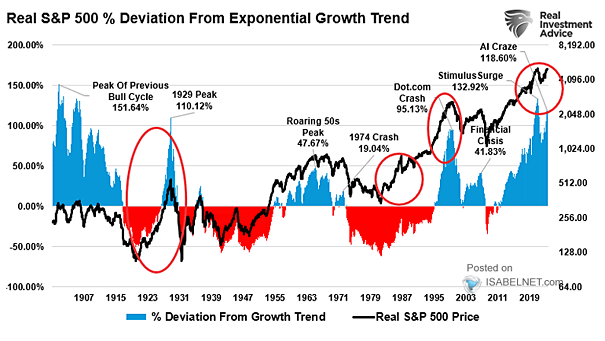
Valuation – Real S&P 500 % Deviation from Exponential Growth Trend

Valuation – Real S&P 500 % Deviation from Exponential Growth Trend While the S&P 500’s long-term growth potential remains intact, current valuations suggest that a return to mean levels is not only possible but likely in the future. Image: Real Investment Advice

Returns – S&P 500 Price Index and Implied Trend Growth Rate

Returns – S&P 500 Price Index and Implied Trend Growth Rate Deutsche Bank has increased its year-end 2024 target for the S&P 500 index to 5,750, up from 5,500, driven by continued robust corporate performance and strong investor demand. Image: Deutsche Bank

GDP Growth Revision

GDP Growth Revision The U.S. economy demonstrates resilience and promising growth outlook, in contrast to the EU and China, which face slower recoveries and economic challenges. Image: Deutsche Bank

EPS Growth – Political Party and S&P 500 Profits Cycle

EPS Growth – Political Party and S&P 500 Profits Cycle While election results can impact markets in the short term, the underlying profitability of companies is a stronger driver of stock prices over time. Image: BofA US Equity & US Quant Strategy

Valuation – Relative Forward P/E of Russell 1000 Value vs. Growth Indices

Valuation – Relative Forward P/E of Russell 1000 Value vs. Growth Indices The current landscape for value and growth investing reveals a significant and persistent valuation gap, with value stocks trading at lower prices relative to their growth counterparts. Image: BofA US Equity & Quant Strategy

Contributions to U.S. GDP Growth

Contributions to U.S. GDP Growth Goldman Sachs predicts a 2.2% Q4/Q4 expansion in U.S. GDP for 2024, surpassing consensus estimates and highlighting the economy’s resilience. Image: Goldman Sachs Global Investment Research

Global Composite PMI and EPS Growth

Global Composite PMI and EPS Growth The Global Composite PMI serves as a leading indicator for EPS growth, with its trends providing insights into future corporate earnings performance. Image: J.P. Morgan

Performance – Large Cap Growth vs. Small Cap Value

Performance – Large Cap Growth vs. Small Cap Value Large-cap growth stocks are outperforming small-cap value stocks at a level not seen since the dot-com bubble era. Historical patterns and the potential for economic recovery indicate that this trend may change in the long term. Image: BofA Global Investment Strategy

U.S. GDP Growth

U.S. GDP Growth BofA forecasts a robust U.S. GDP growth of 2.3% quarter-over-quarter (QoQ) seasonally adjusted annual rate (SAAR) in Q2 2024, reflecting the bank’s confidence in the resilience of the American economy. Image: BofA Global Research

Deviation of Earnings Above/Below Long Term Growth Trend

Deviation of Earnings Above/Below Long Term Growth Trend Some investors are becoming concerned as the current earnings estimates deviate significantly from the long-term growth trend, along with the effect of a Fed rate-cutting cycle. Image: Real Investment Advice