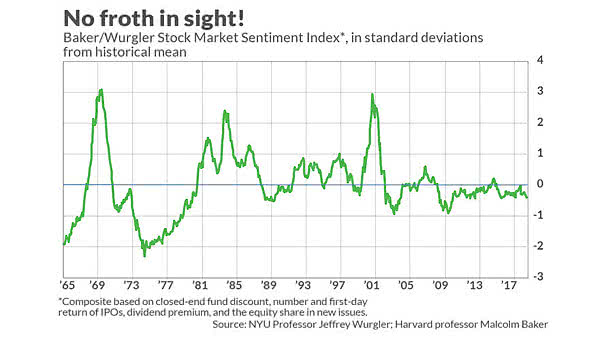
US Equity Market Sentiment and Relative ETF Flows Since 2018
US Equity Market Sentiment and Relative ETF Flows Since 2018 This chart shows the correlation between US equity market sentiment and relative ETF flows recently. Inflow to US equity type ETF has picked up recently. Image: Nomura